Using Calculations
Overview
Analytics allows you to run custom calculations and formatting against particular fields. This has many uses, but can be particularly useful in presenting raw data in a human-readable format.
Example
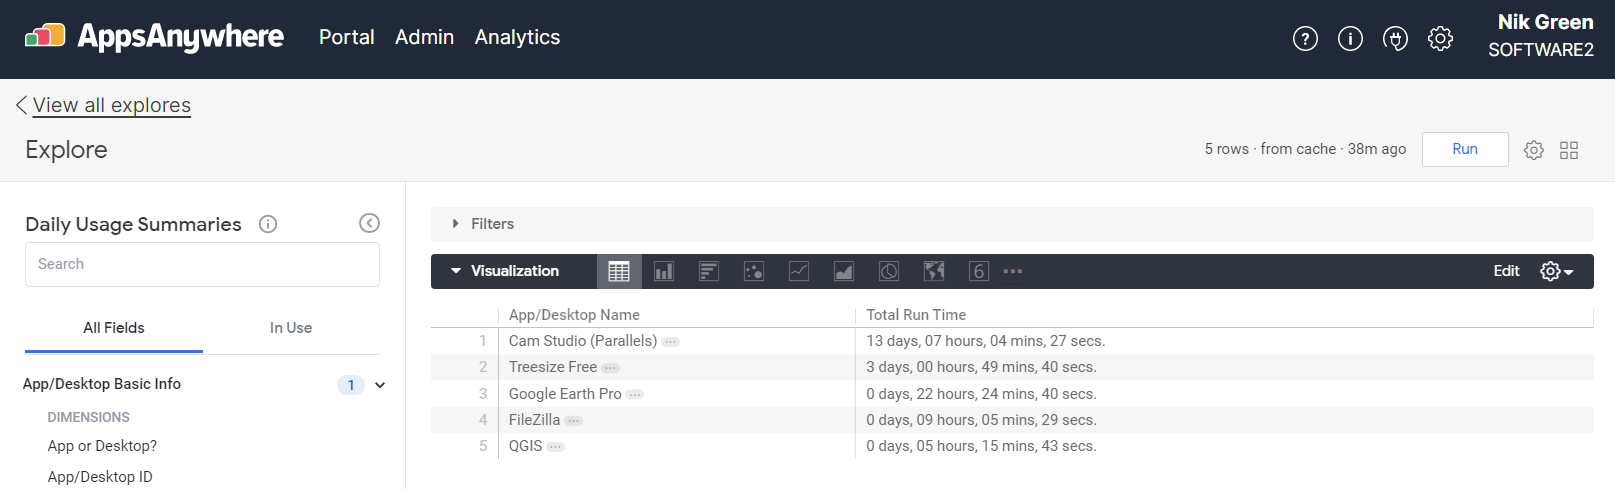
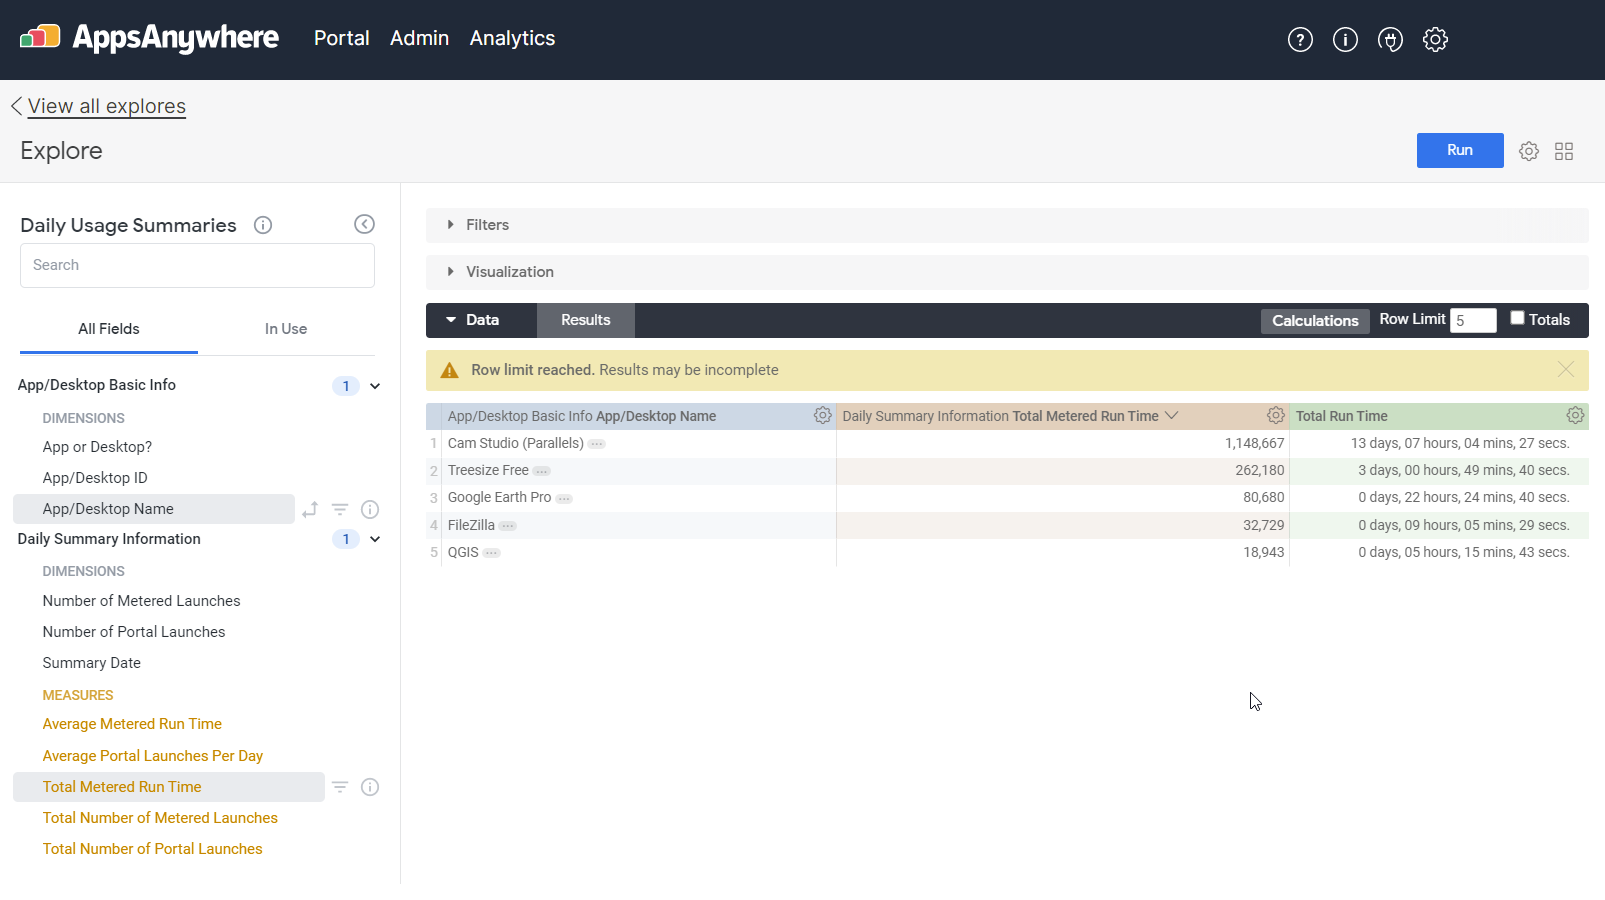
Using the Daily Usage Summaries Explore, create a simple report to show the Total Metered Run Time for each application (App/Desktop Name)
Hit Run and view the Visualization as a Table
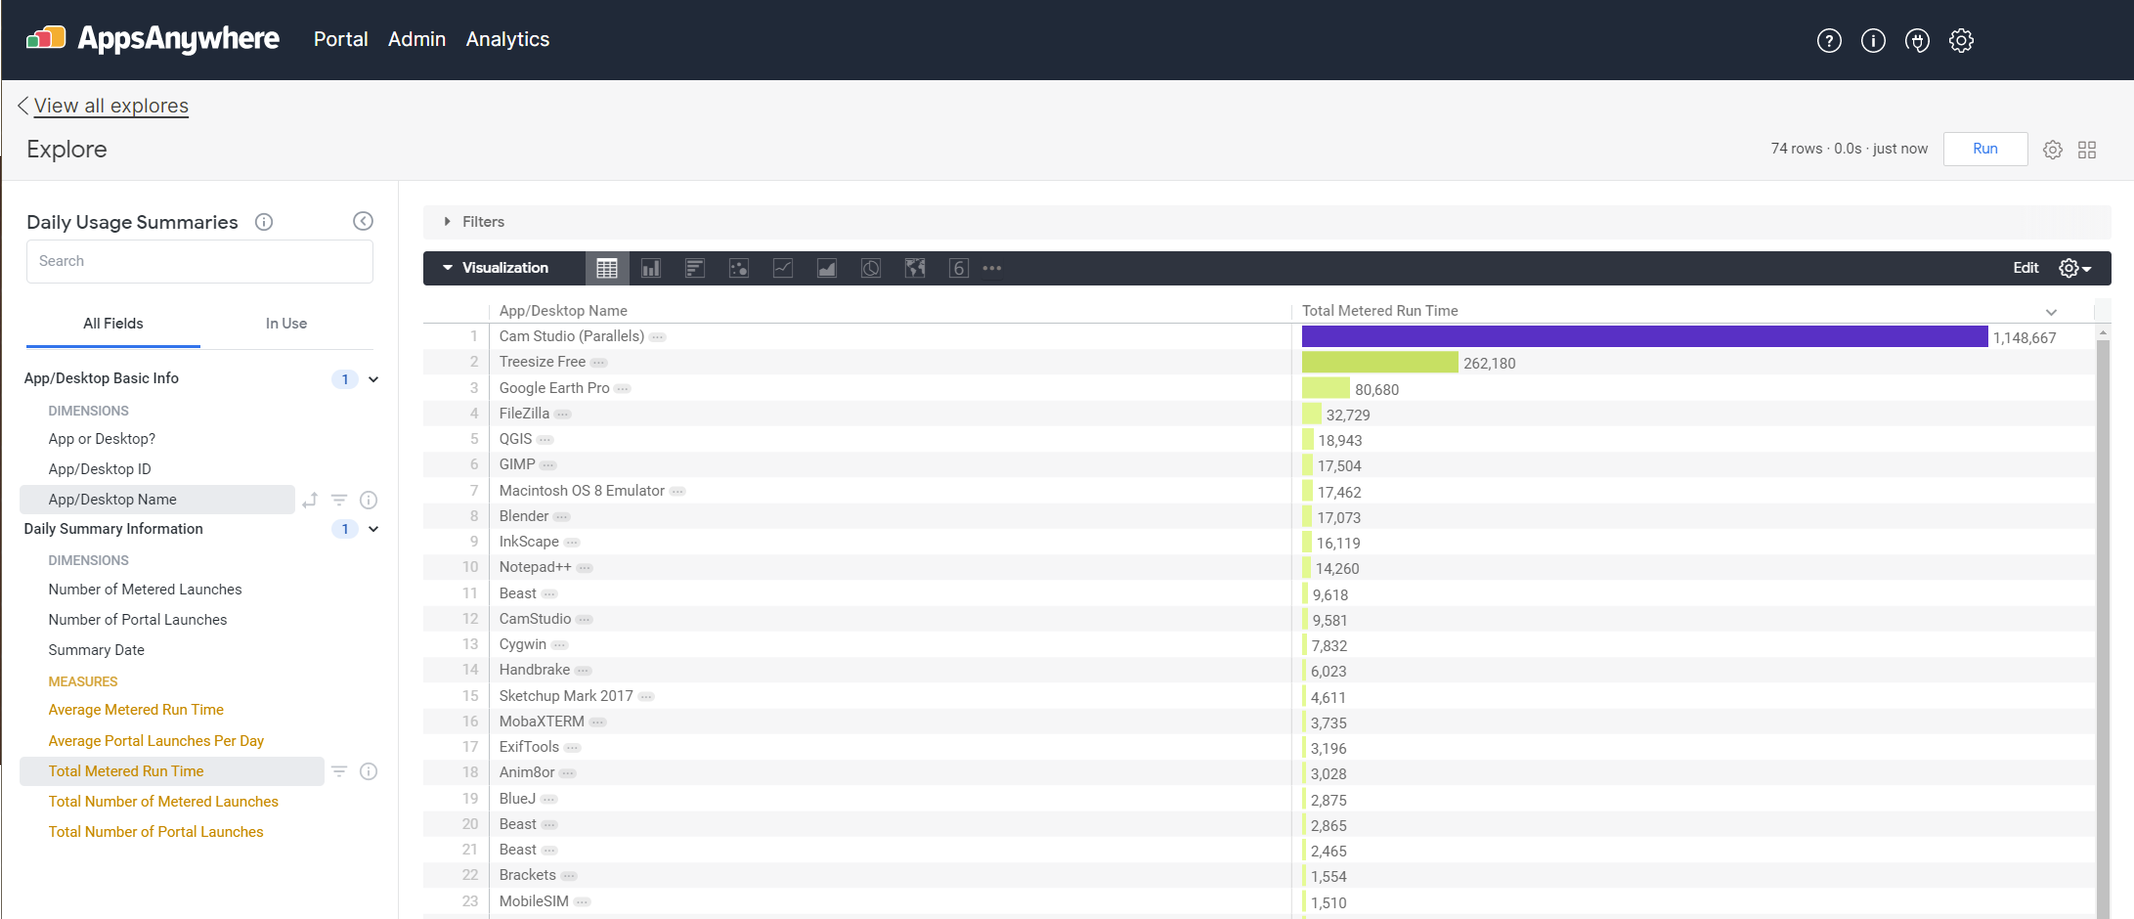
This displays the list of applications and the total run time for each one, expressed as seconds.
As the example above shows, the top application by usage is Cam Studio (Parallels) with is showing as having run for 1,148,667 seconds.
Whilst this is correct and accurate, most people don’t read time in seconds, so it would be useful to be able to format or calculate a more ‘human readable' value to display.
Creating a calculation
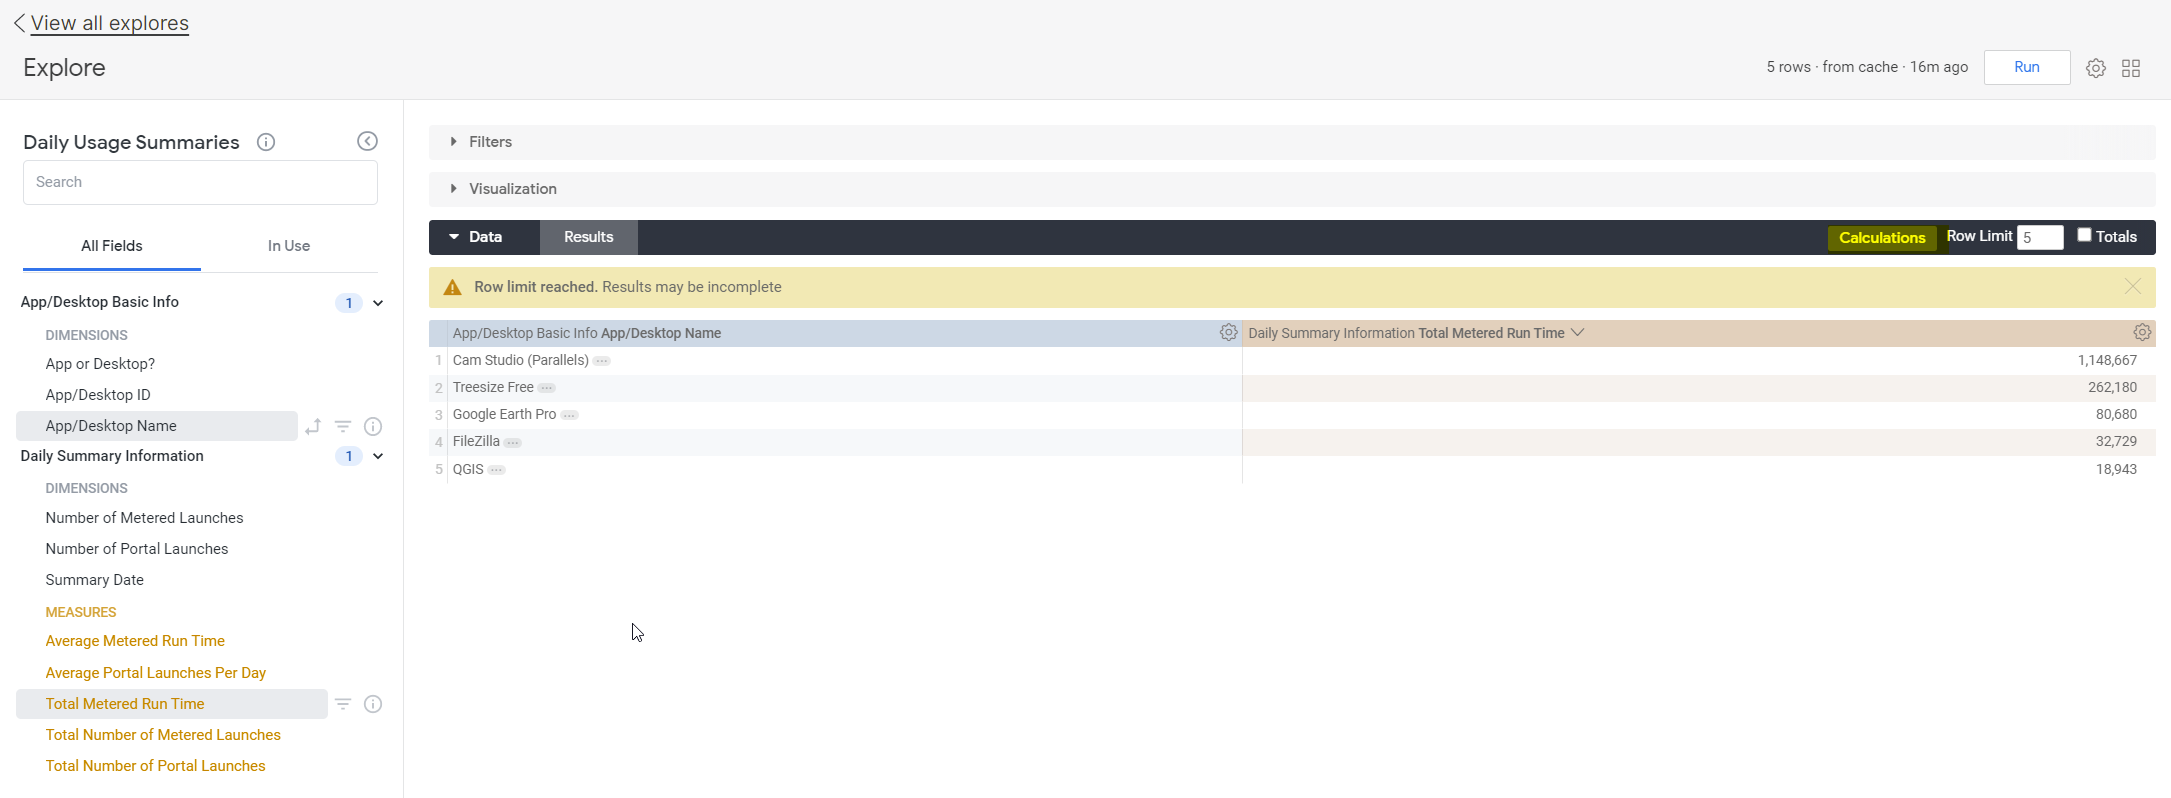
From the Data, tab choose the Calculations button
In the Edit Table Calculation dialogue, reformat the time value and give the calculation a meaningful name.
Then select the field you wish to calculate on. This query window is autocompleted, so as you start to type it will filter the results. Below we want to select the T
otal Metered Run Timevalue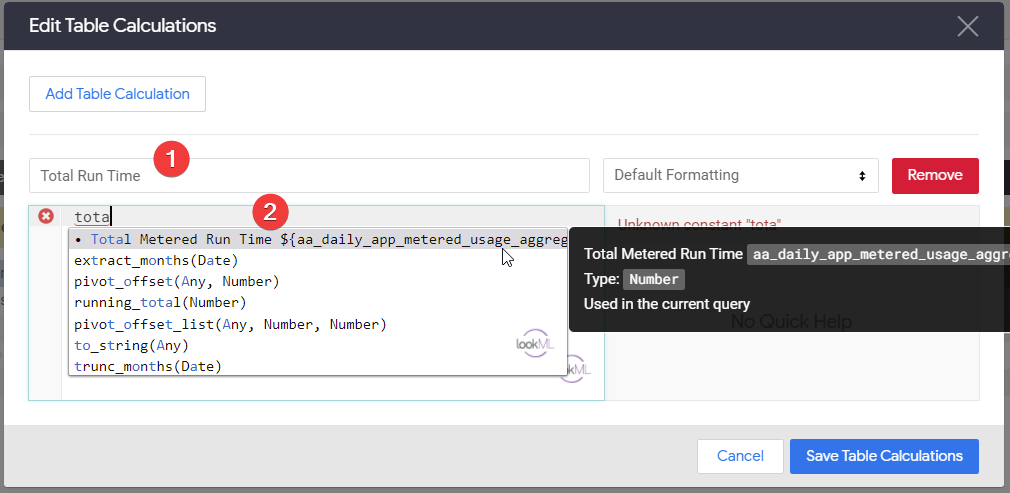
Once selected it will populate the query window and you can add other values manually if required.
Because the recorded data displaying the total run time is recorded in seconds, we pull that value and then divide by 86400 (the number of seconds in a day)${aa_daily_app_metered_usage_aggregates.total_run_time}/86400If this calculation is left as is with the default formatting, then this particular calculation will reformat the value to display as days, rounding up or down to the nearest day.
However, custom formatting can be applied to make a more standard display of time spent.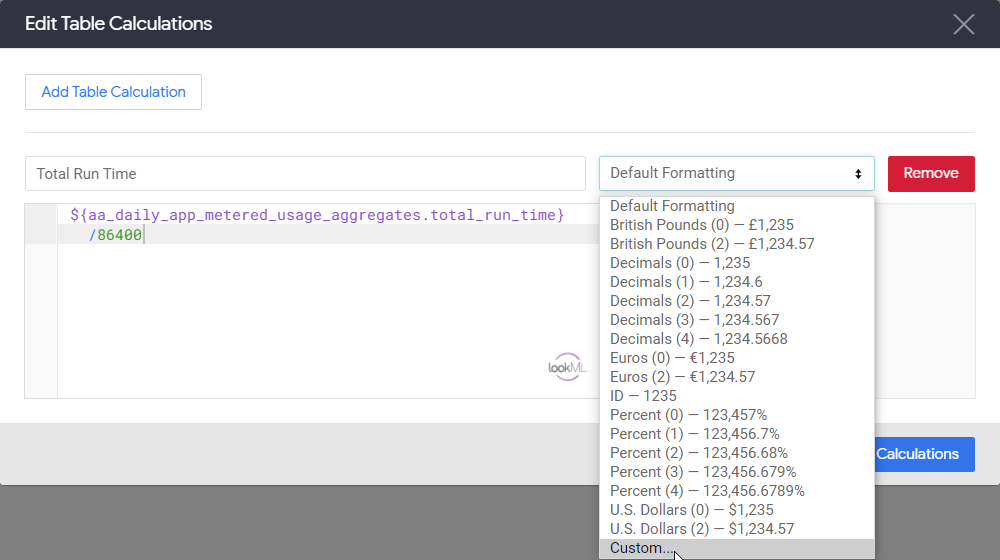
In the Custom… field we can enter standard date notation to change the display a more readable d HH:MM:SS using the following syntax
d" days, "hh" hours, "mm" mins, "ss" secs."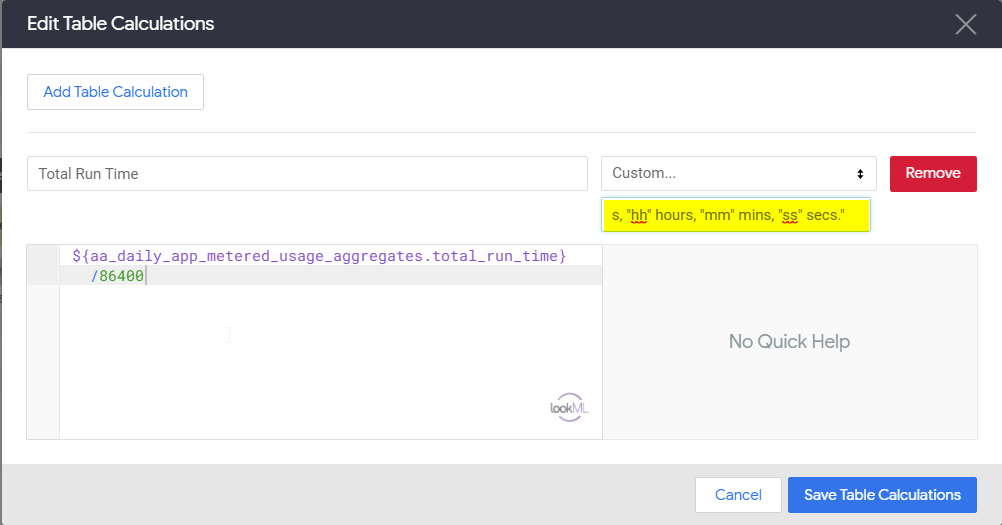
At this point, you can add a second calculation if needed, or press the Save Table Calculations button.
The new formatted value is now displayed in the Data and Visualization table of your report.
To stop the original value (seconds) from being displayed in your visualization, it can be hidden via the Data tab
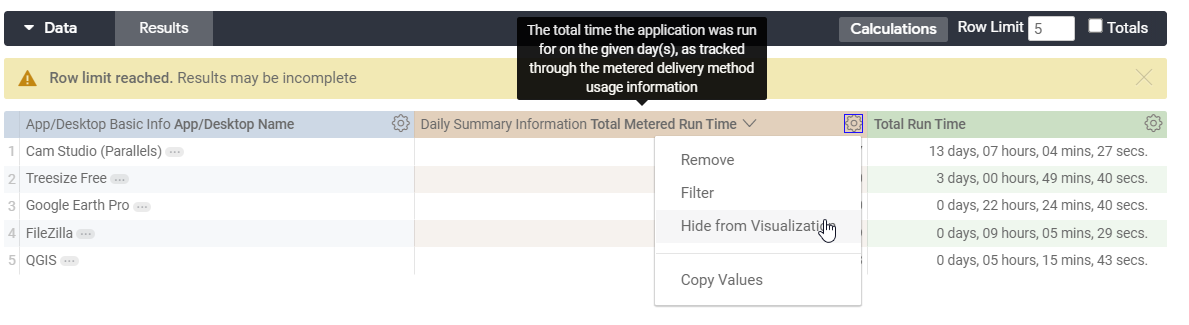
Your report now shows the correct formatted Total Run Time and can now be saved/added to your Dashboards as required.