Using Dashboards
Overview
AppsAnywhere Analytics allows you to create a whole range of reports centred around specific areas, these can be saved to dashboards for future reference, or to share with colleagues. Whether you are looking for reports you or your colleagues have created or ones that were provided with Analytics by default, everything is accessed through dashboards. In this article, we'll take you through everything you need to understand about how to find and interpret dashboards.
Finding the Dashboards
If you are an Analytics user, you will have access to a page which shows all the dashboards you have access to. To navigate to this page:
Log into AppsAnywhere as a user with either the Analytics User or Analytics Explorer role
Click on Return to Admin (or Return to Analytics if you are not an admin) to access the AppsAnywhere admin portal
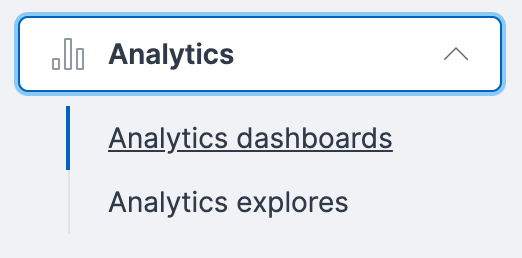
If you have the Analytics User role, or Analytics > Dashboards if you have the Analytics Explorer role
Landing Dashboard
The landing dashboard is the first dashboard you see. This contains a general overview of your system usage, including:
Logins in the past 30 days
Number of active users in the past 30 days
Number of unique devices seen in the past 30 days
Top 10 resources (by number of launches) this month
A breakdown of the operating systems used by the people logging in
A list of all applications and desktops that have been launched through the system
A geographical overview of application launches by country
Clicking on an app or desktop in the All applications and All desktops tables will take you to a more detailed dashboard with gives you much more detail on the app or desktop
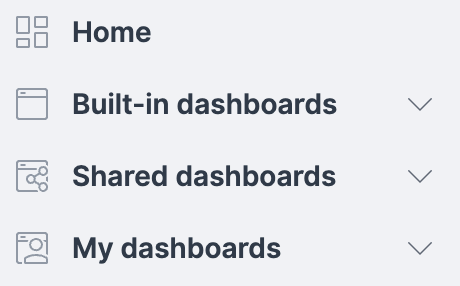
To return to this dashboard at any time, click the Home button in the sidebar.
Types of Dashboards
There are three types of dashboard in AppsAnywhere, all of which are accessed from the left-hand menu in the Analytics interface. These are:
Built-in dashboards
Shared dashboards
My dashboards
Built-in Dashboards
The Built-in dashboards are provided by default, they were built by AppsAnywhere in close collaboration with customers and are a great starting point for gaining insights into AppsAnywhere usage. You will most likely start using Analytics by viewing these dashboards, before moving onto creating your own reports and dashboards as you get used to the system and get a better idea of exactly what you want to see.
When you do start wanting to create your own reports, a great way to learn the system and get a feel for how dashboards are created is to take a look at how we made these built-in dashboards, as described on the Creating the Built-in Dashboards article.
Shared Dashboards
Shared Dashboards are dashboards created by people within your organization. Dashboards saved in the shared space will appear here and can be viewed by any of your colleagues with access to Analytics. This is a great place to save dashboards that you have created that you want other people to see.
My Dashboards
When you create a dashboard and save it in your personal space, it will appear in the My Dashboards section. The dashboards in this section are only visible to you and this is a great place to save things that only you are interested in, or any dashboards you are still working on that aren't yet ready to share.
Filtering
The Built-in dashboards allow you to filter by certain parameters.
To open the filters, navigate to any of the built-in dashboards and click Show Filters at the top of the page.
There are several filters that may be present, these are:
Date range in which the launch occurred
Organization-owned or user-owned (BYOD) devices
On-domain or off-domain devices
On-site or off-site launches
The date range allows you to select the range of times what you want to see data for, while the toggle buttons allow you to toggle between one value and both. Where possible, data in all of the tiles on that dashboard will be limited by the filters you apply at the top of the page.
On some dashboards, some filters may be disabled if they are not appropriate to the data being displayed on that dashboard