Using Calculations
Overview
Analytics allows you to run custom calculations and formatting against particular fields. This has many uses, but can be particularly useful in presenting raw data in a human-readable format.
Example
Using the Daily Usage Summaries Explore, create a simple report to show the Total Metered Run Time for each application (App/Desktop Name)
Hit Run and view the Visualization as a Table
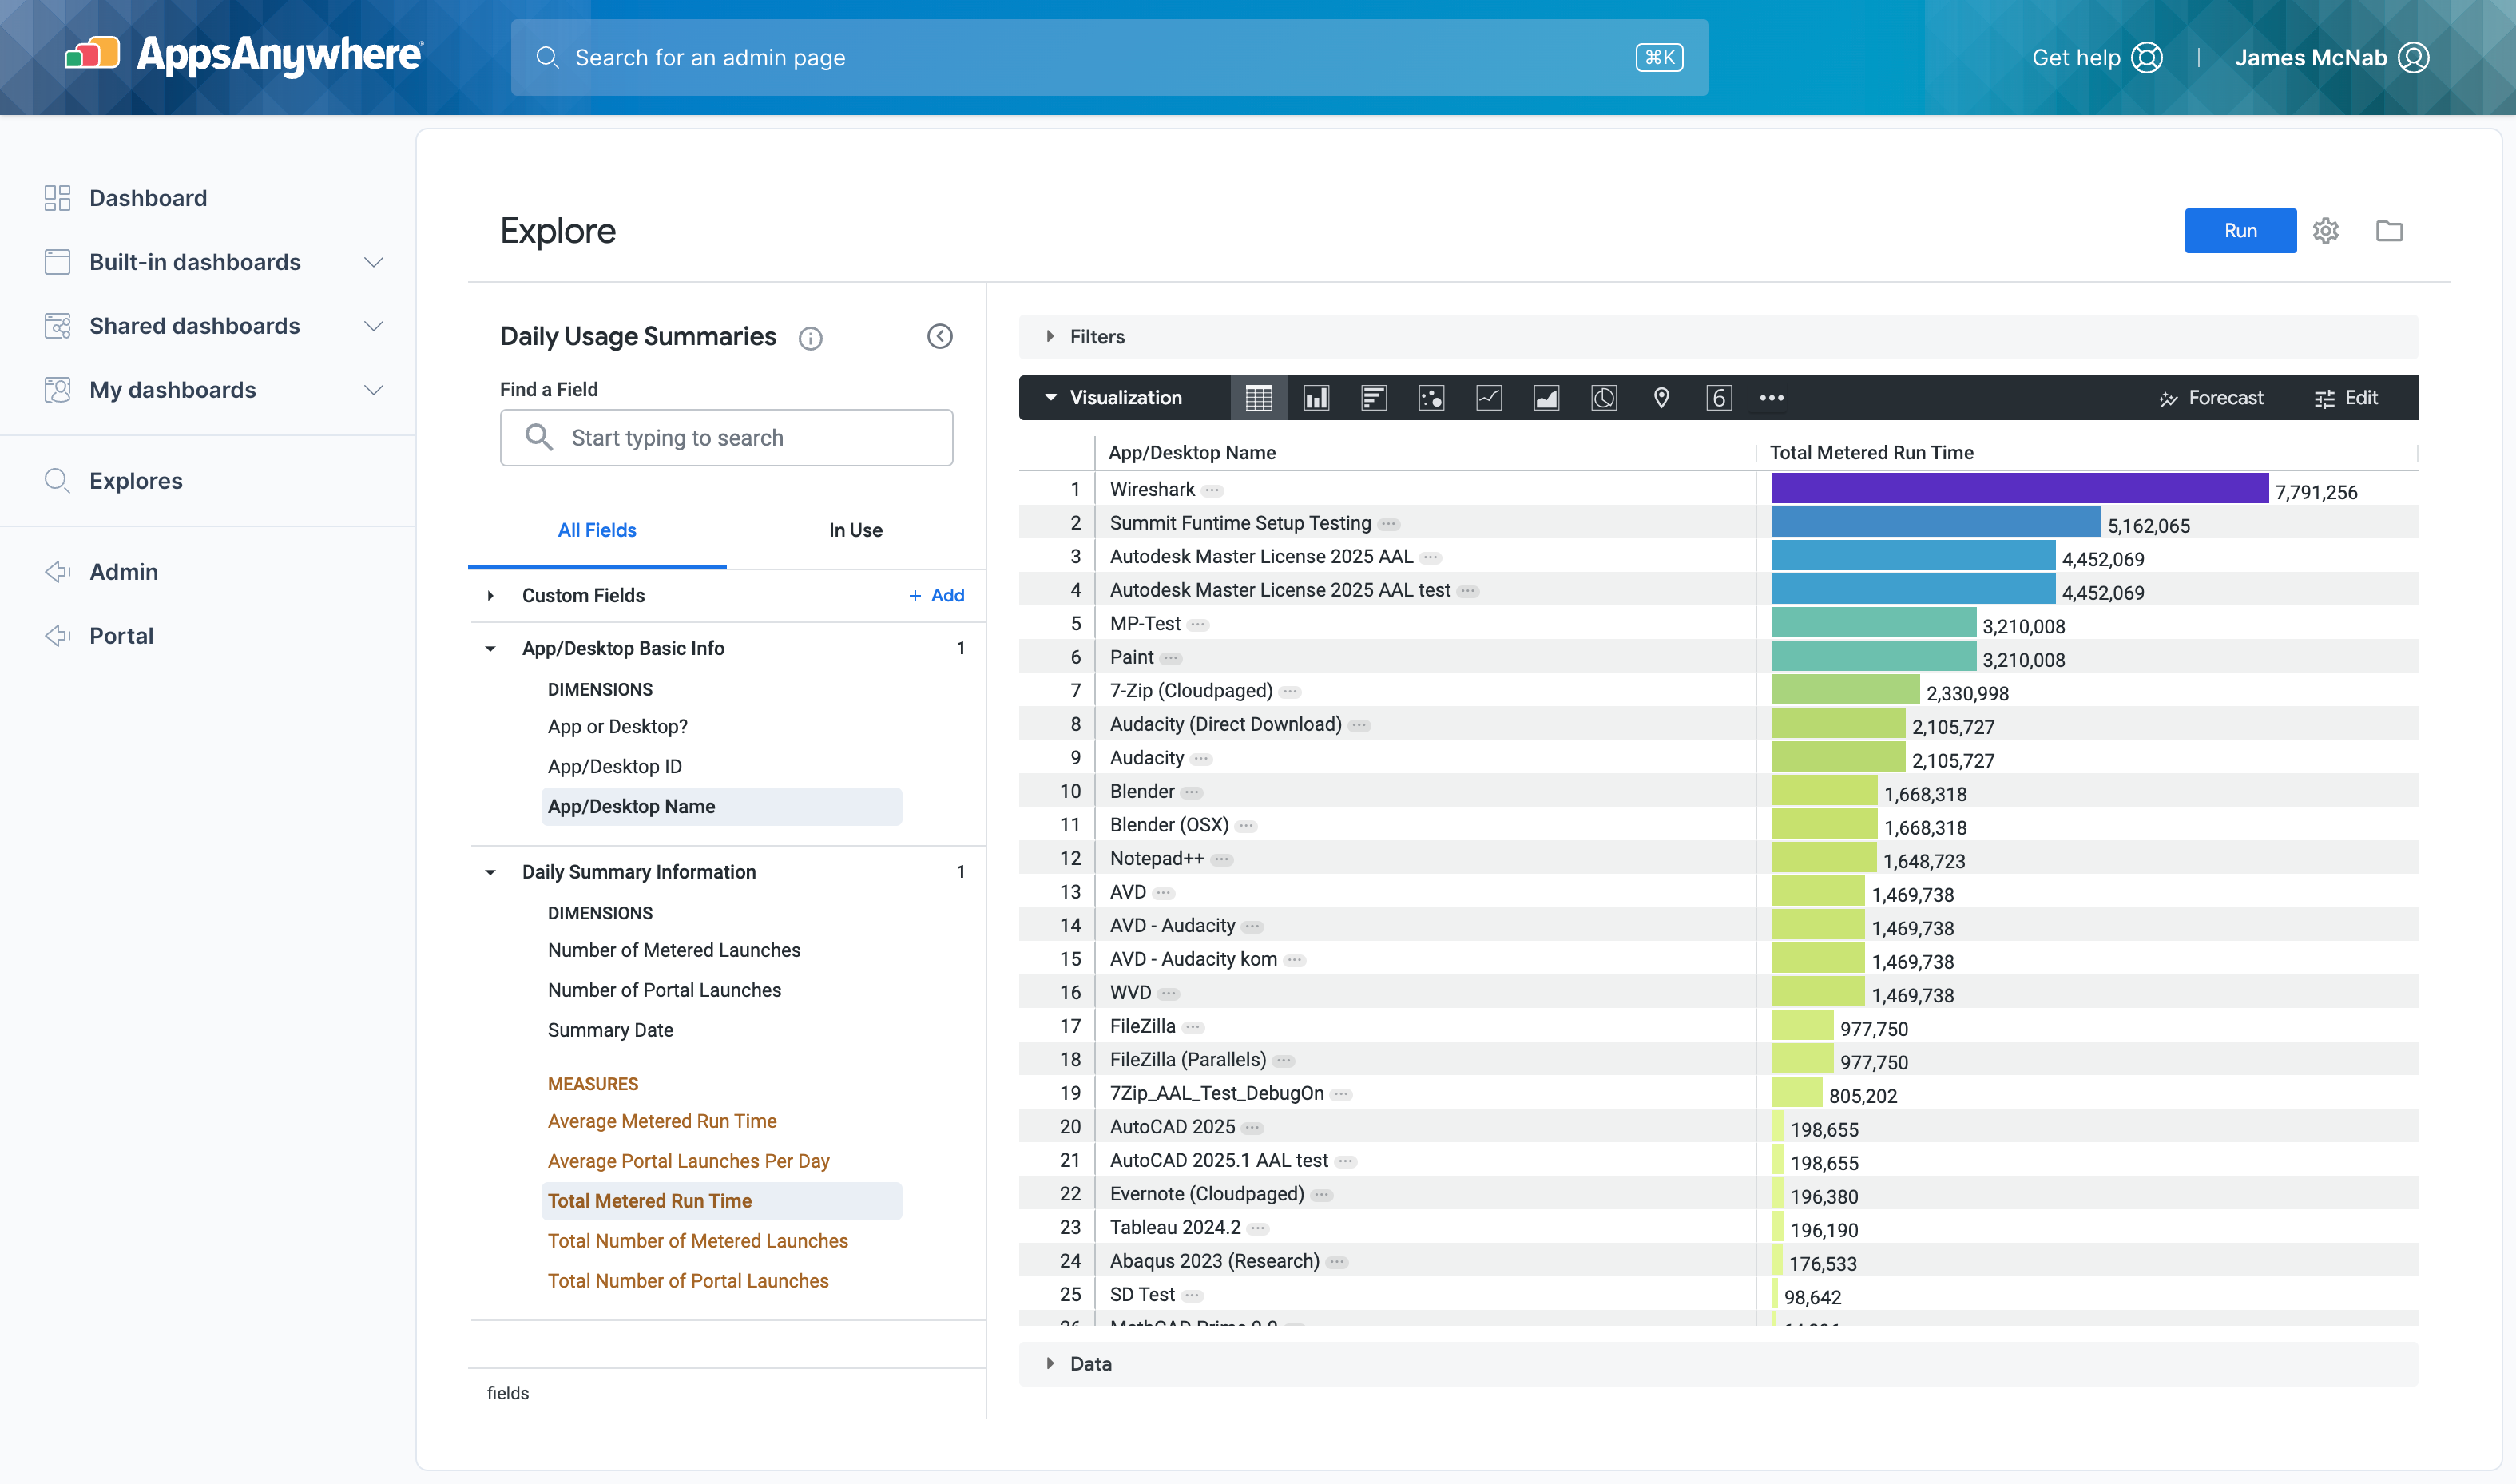
This displays the list of applications and the total run time for each one, expressed as seconds.
As the example above shows, the top application by usage is Wireshark with is showing as having run for 7,791,256 seconds.
Whilst this is correct and accurate, this is is not the most understandable way to present this information, so it would be useful to be able to format or calculate a more ‘human readable' value to display.
Creating a calculation
Example: Metered application runtime in hours
In this example we will convert the total recorded run time for applications from seconds to hours.
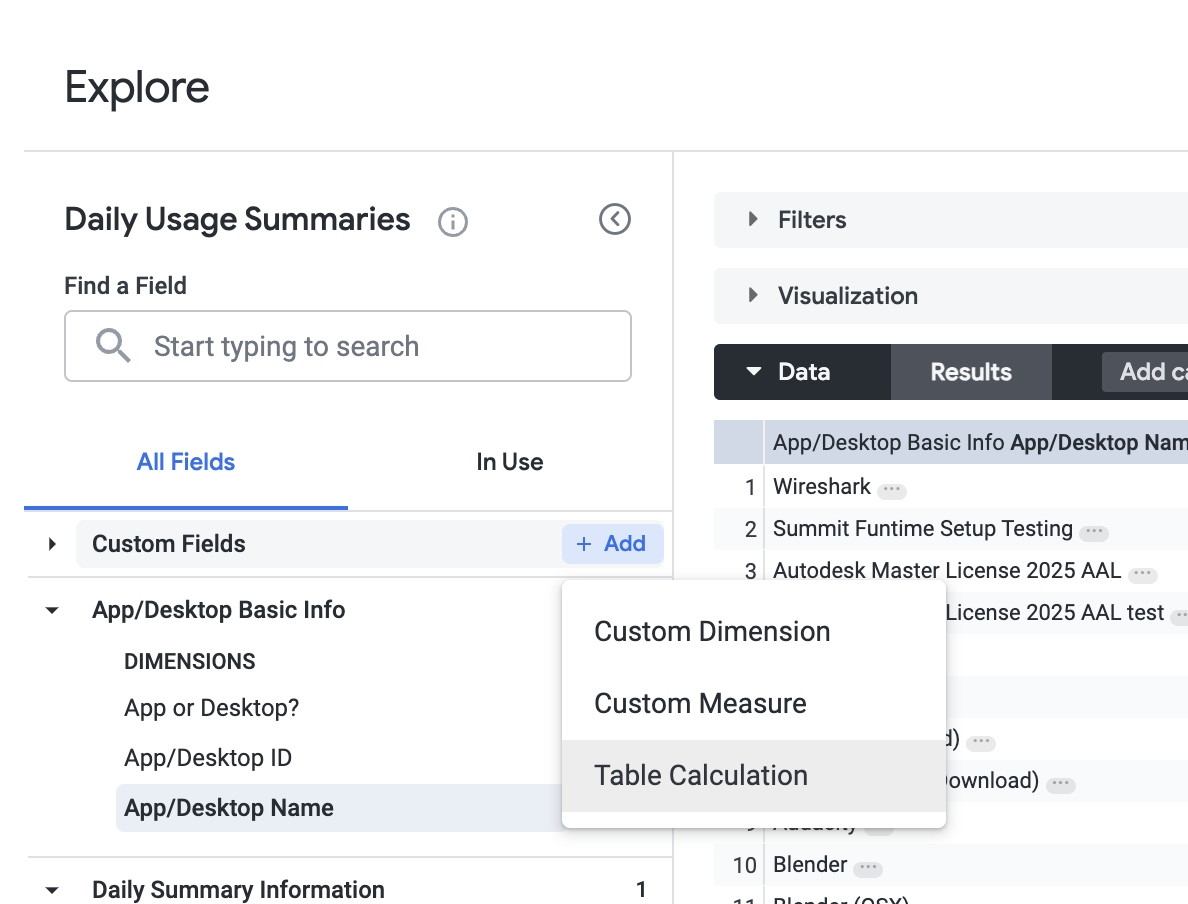
From the field selector find Custom Fields and select + Add
From the dropdown menu, select Table Calculation
The Create table calculation dialogue will be displayed
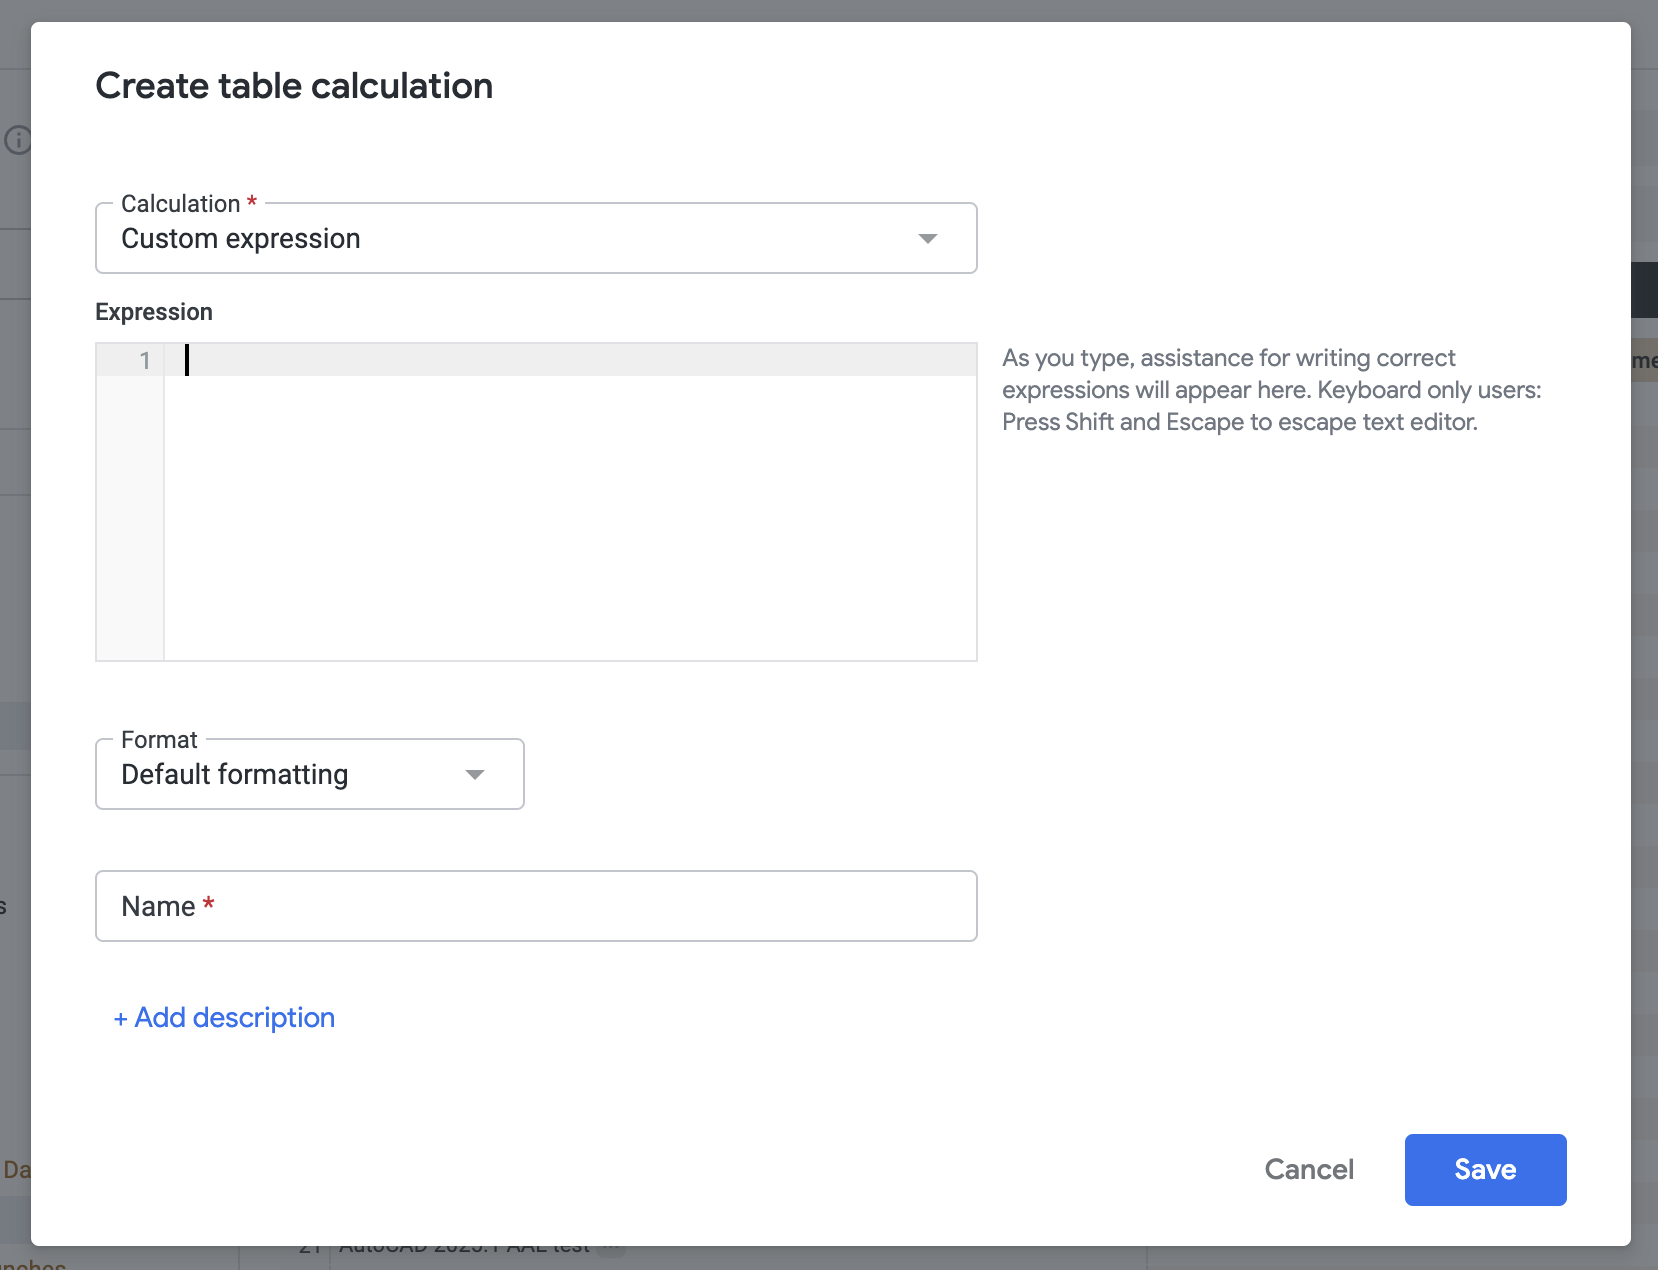
From the Calculation dropdown, select Custom expression (this is the default)
Then select the field you wish to calculate on. This query window is autocompleted, so as you start to type it will filter the results. Below we want to select the
Total Metered Run Timevalue.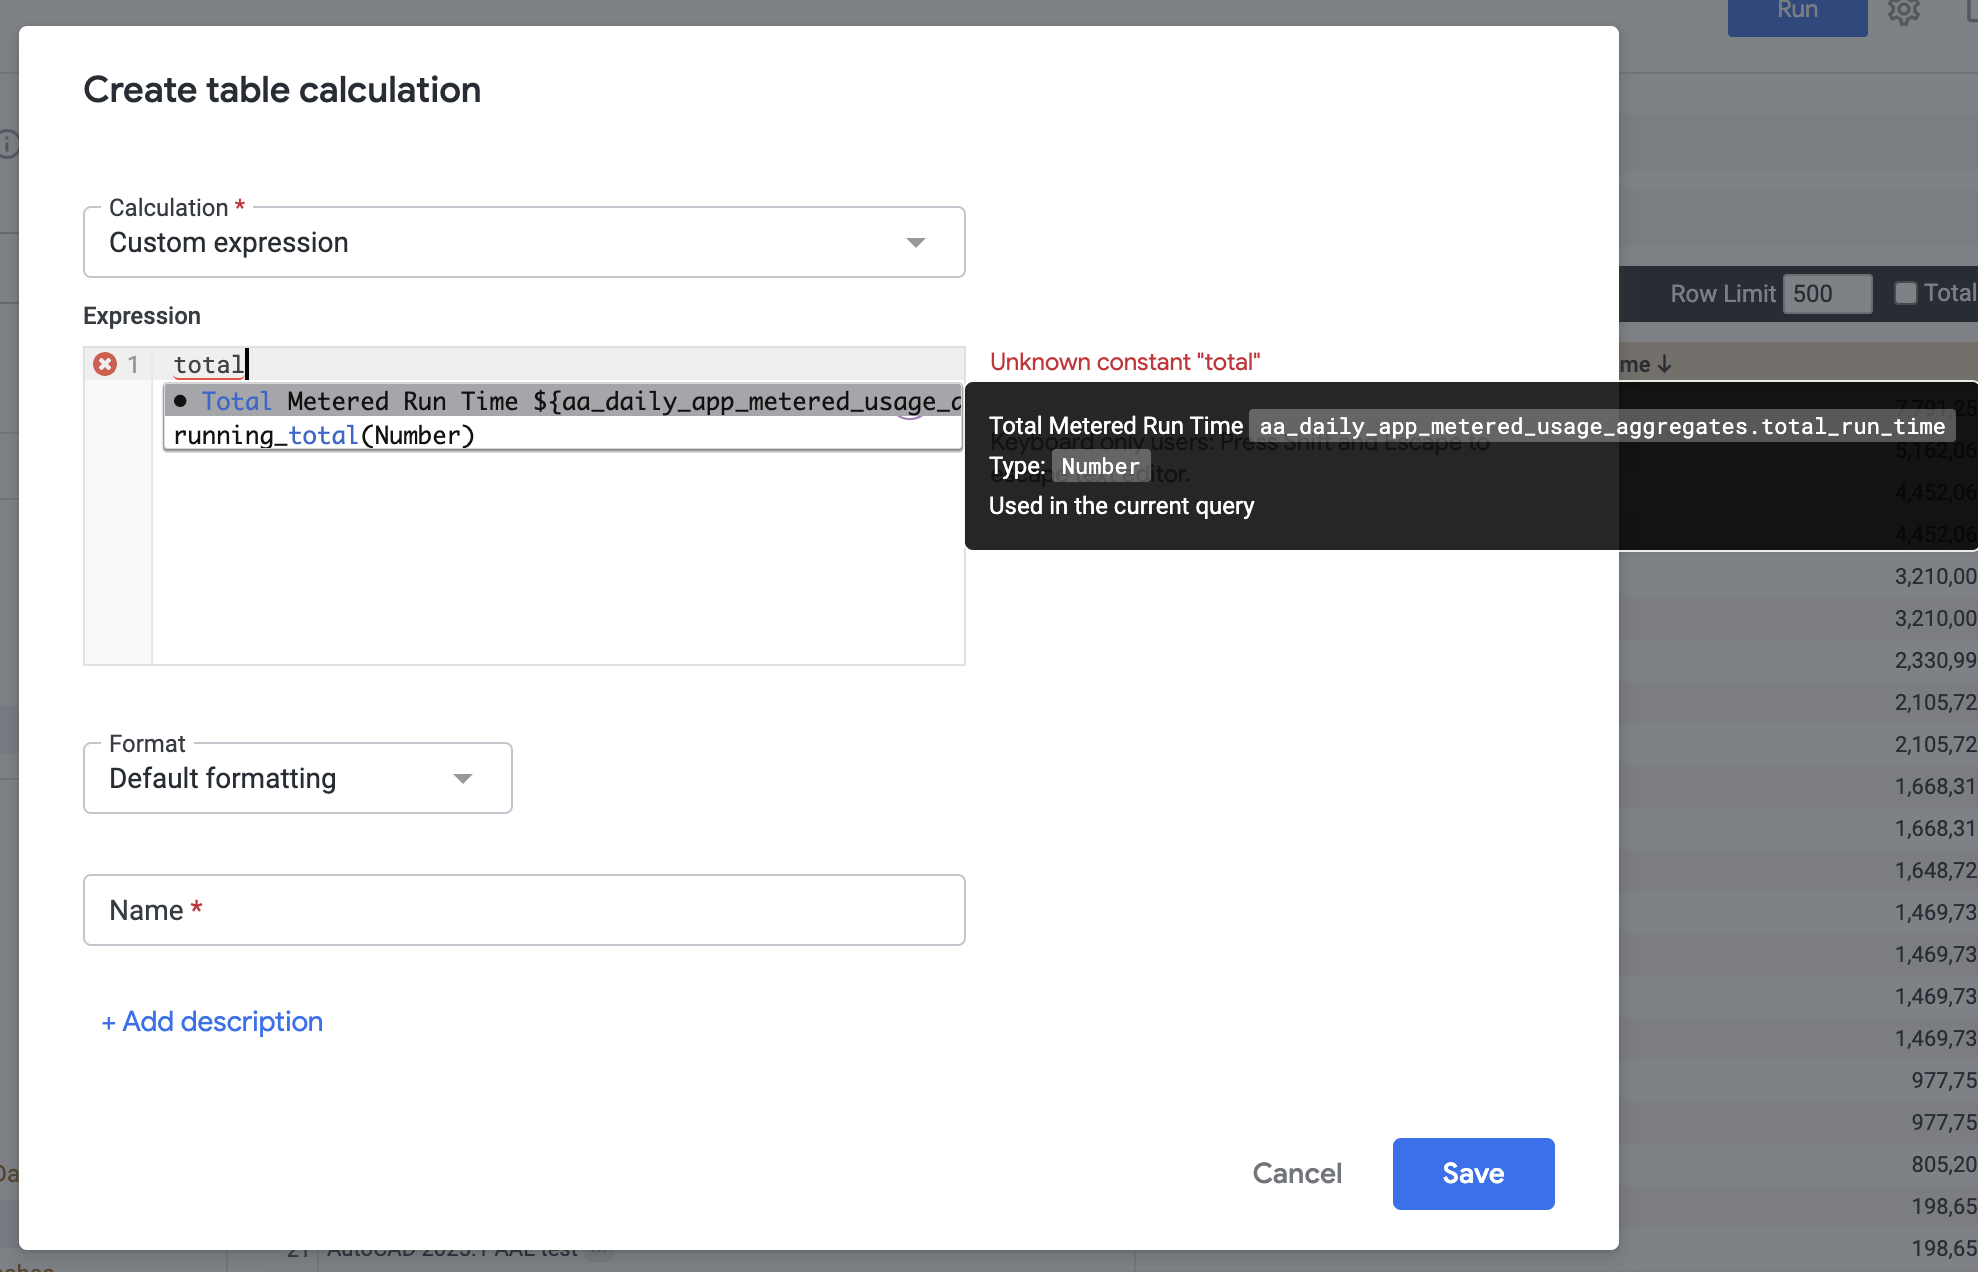
Once selected it will populate the query window and you can add other values manually if required.
Because the recorded data displaying the total run time is recorded in seconds, we pull that value and then divide by 3600 (the number of seconds an hour)
${aa_daily_app_metered_usage_aggregates.total_run_time}/3600For Format, select Decimals and enter the required number of decimal places. In this example we will use 0 which will cause the values to be rounded up to the nearest whole number.
Give the calculation a Name, which will appear in the data once the calculation is created. In this example we will use “Total Run Time (Hours)”.
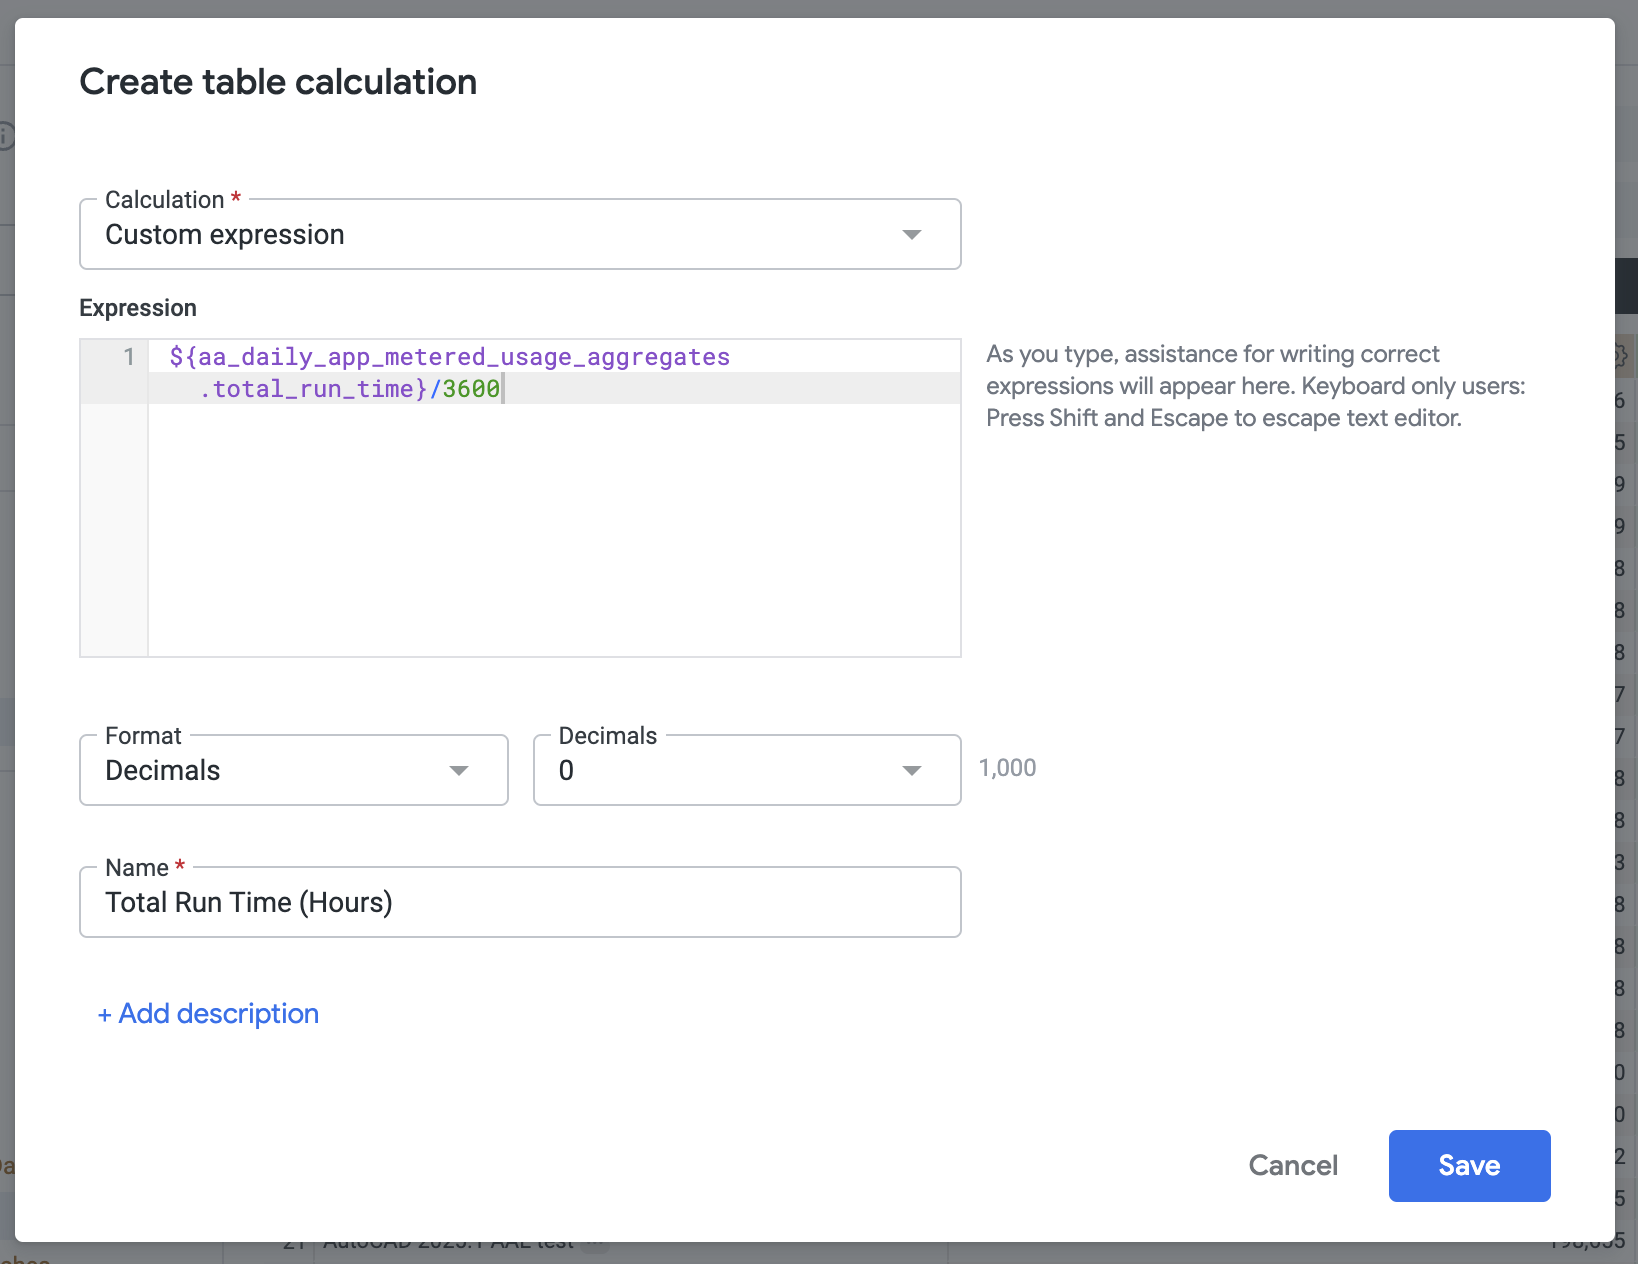
Press the Save button to create the new table calculation
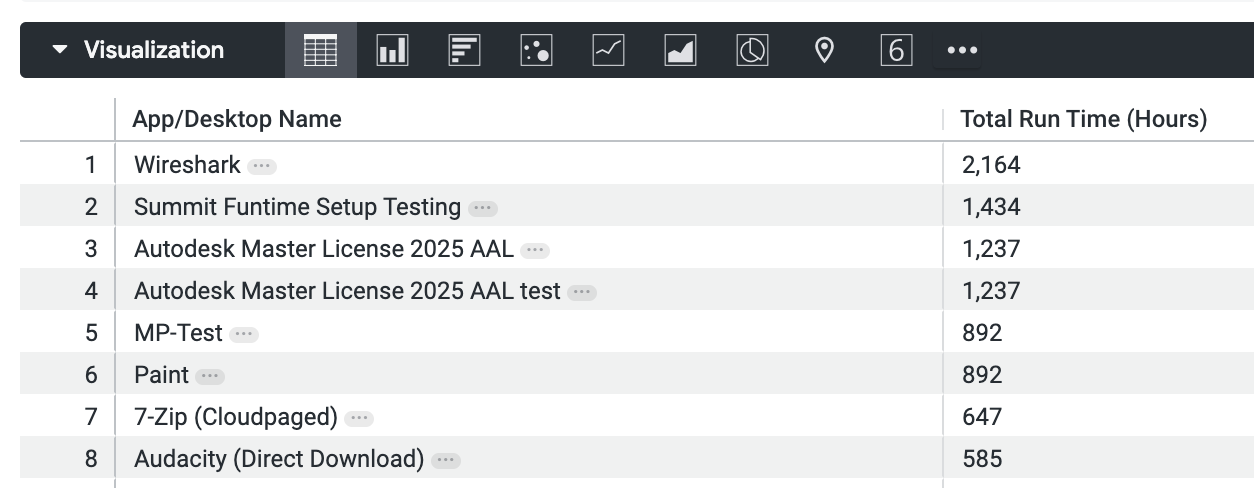
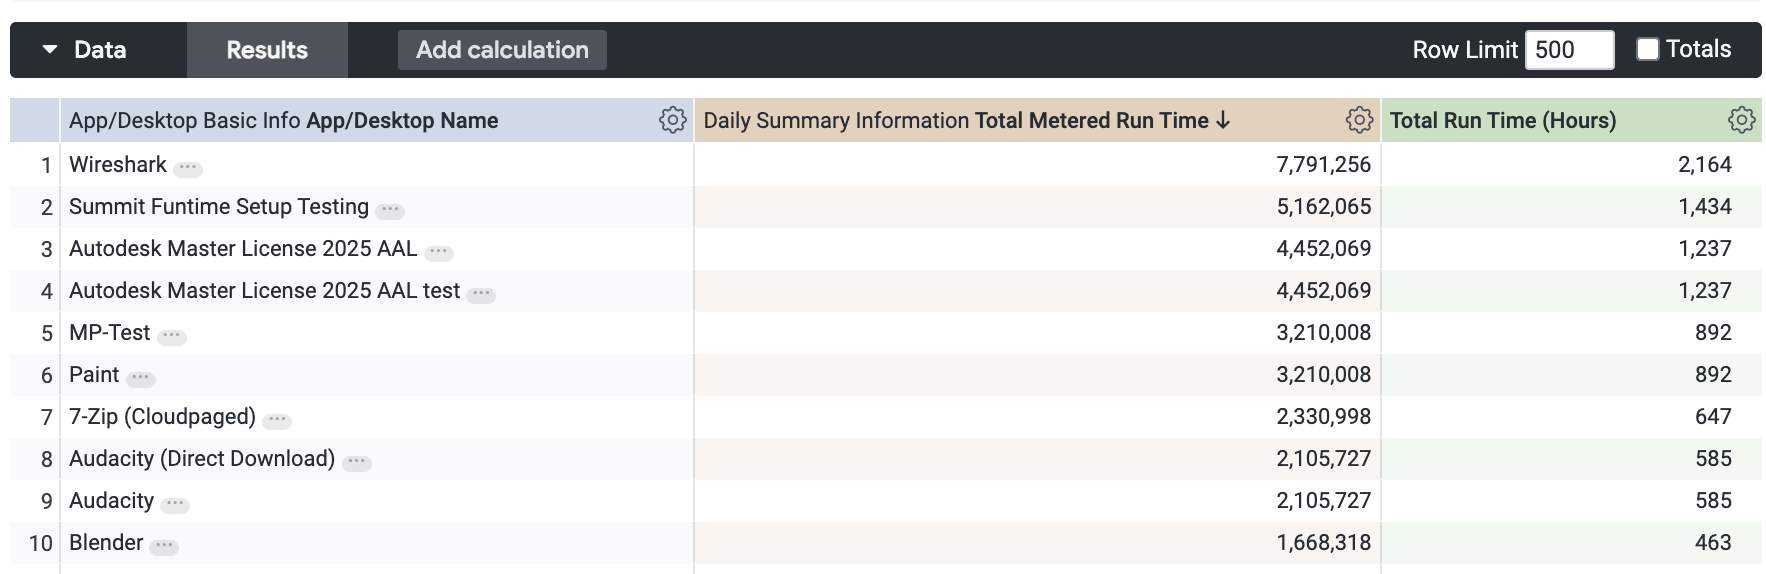
The new calculated value is now displayed in the Data and Visualization views of your report.
To stop the original value (seconds) from being displayed in your visualization, it can be hidden via the Data tab
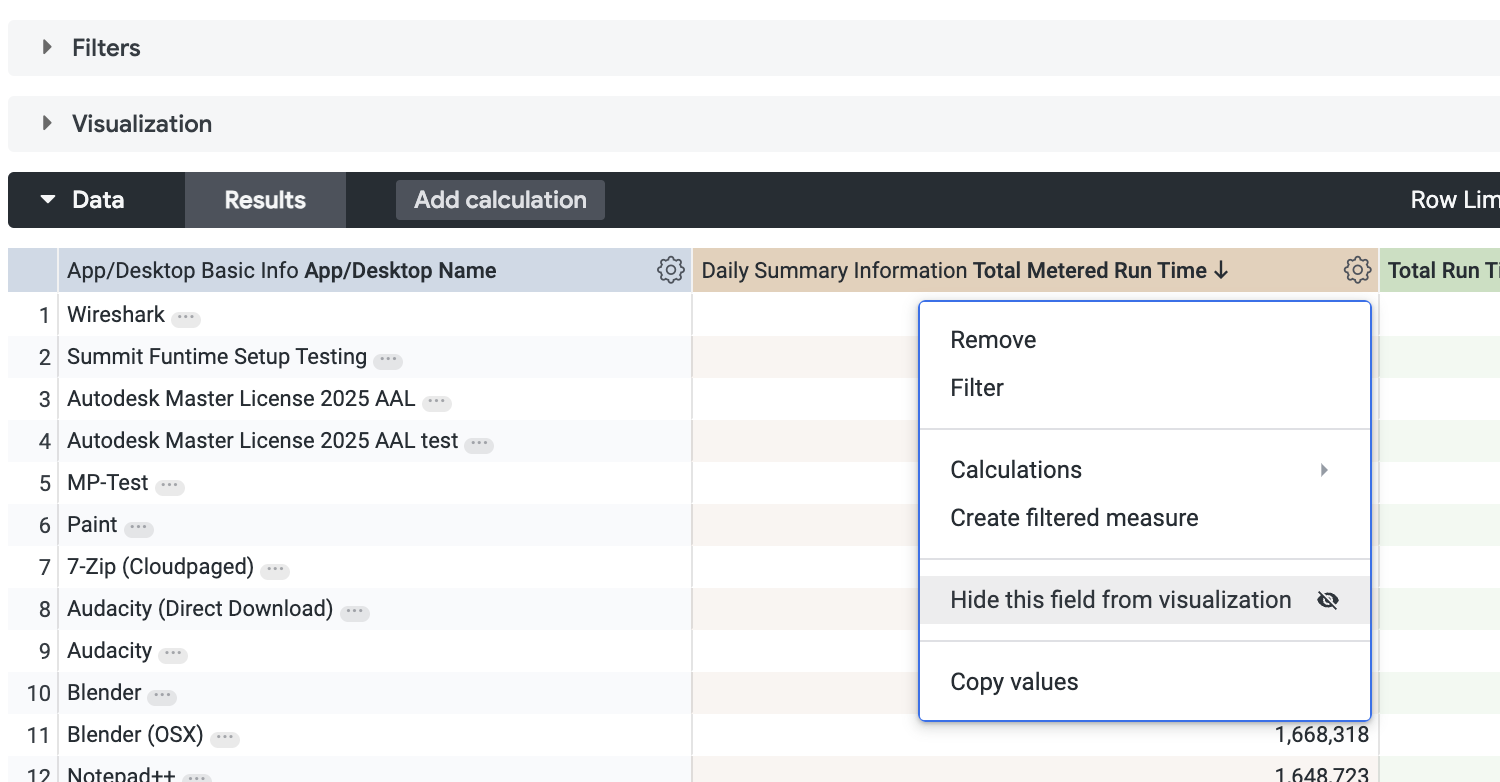
Your report now shows the Total Run Time formatted in Hhurs and can now be saved/added to your Dashboards as required.