
Merging Reports
Overview
Analytics allows the creation of custom reports built around defined datasets (Explores).
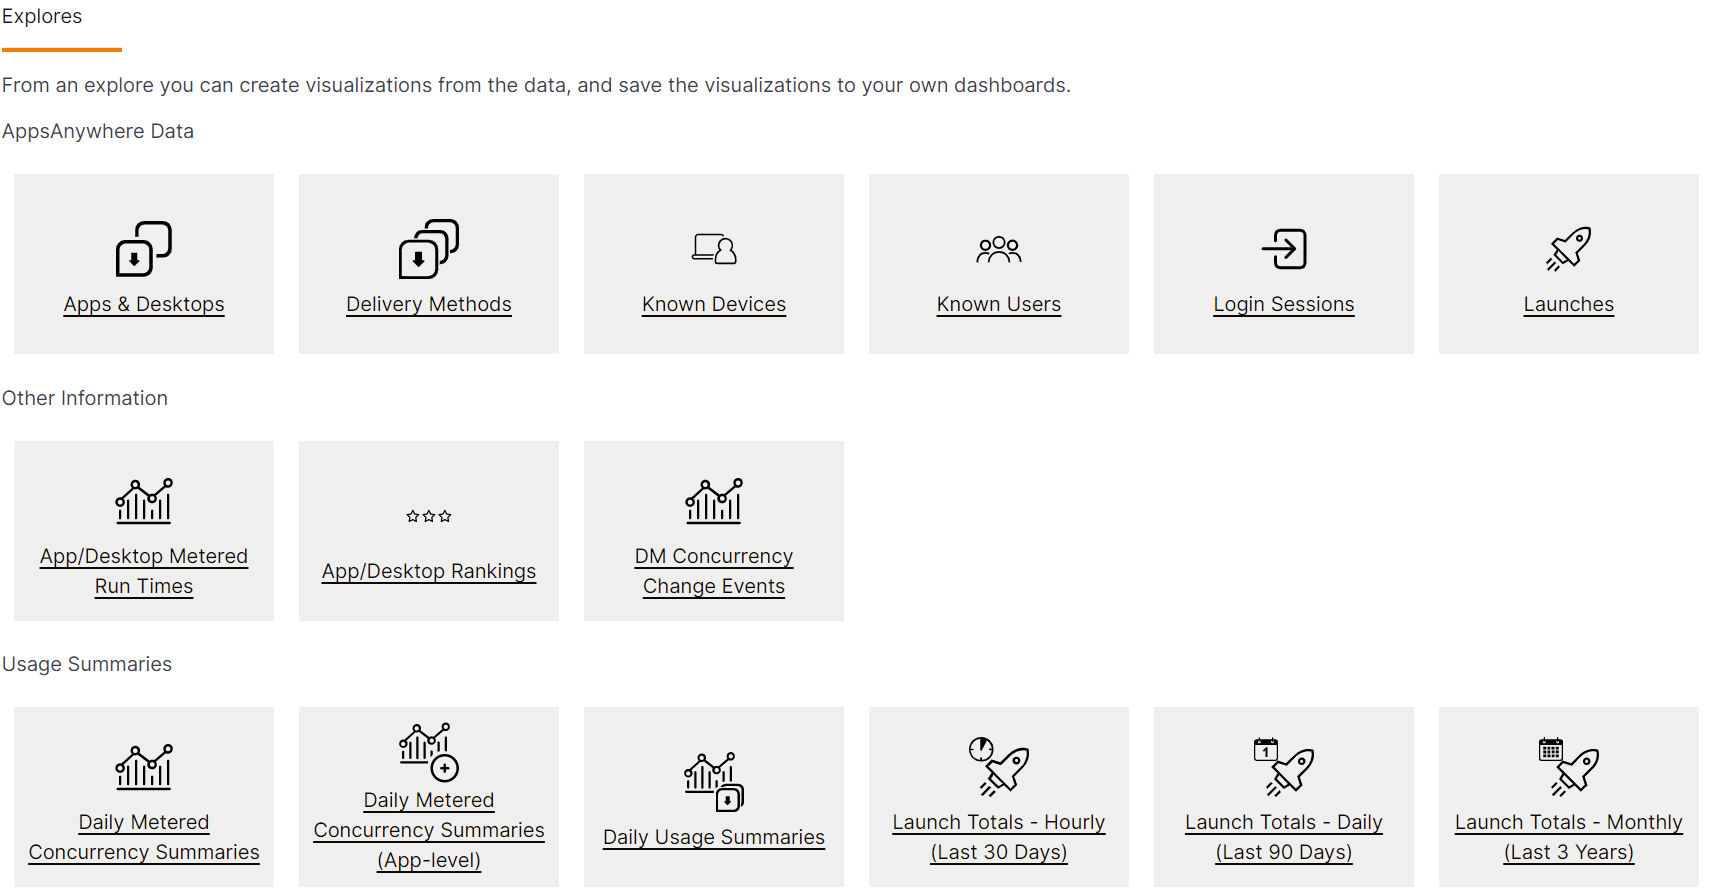
These Explores have been predefined by AppsAnywhere to present relevant data about AppsAnywhere installation and usage.
A lot of the time you will be able to pull the relevant information from a single Explore, but there will be occasions when you need to pull data from two or more Explores in order to add relevance to a particular report. To do this we can use the Merge Reports function within Analytics.
Why Merge Reports?
The report below is an example of where data from two Explores have been merged to provide a single set of results.
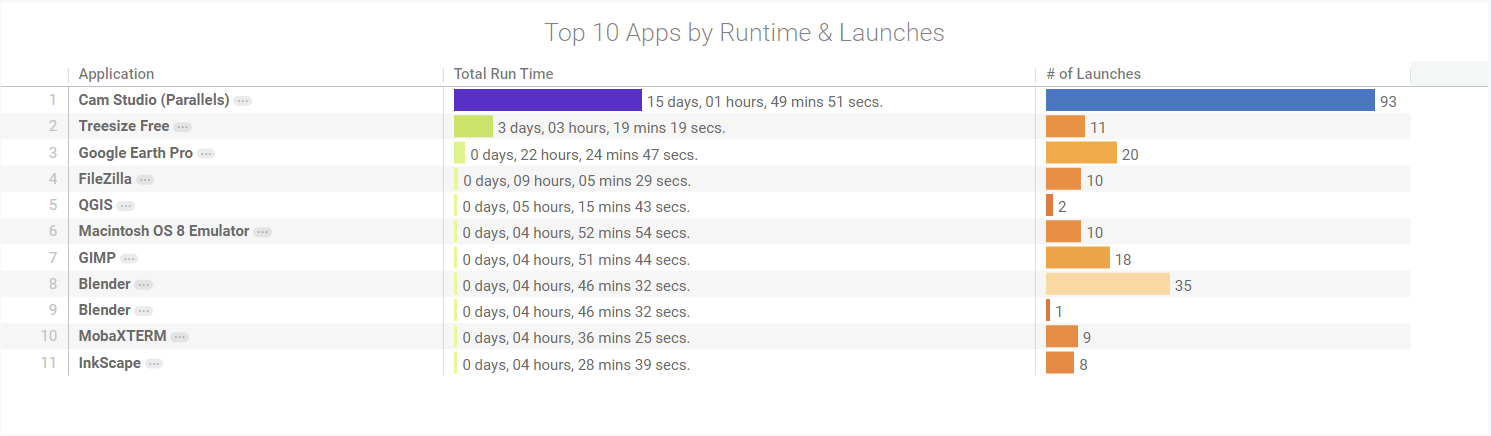
This report consists of data from the two Explores
App/Desktop Metered Run TImes
Fields Used:
App/Desktop Name
Total Run Time
Launches
Fields Used:
App/Desktop Name
Number of Launches
The App/Desktop Metered Run TImes contains calculated totals for how long a particular application has been running but doesn’t have information of the number of application launches, however, this is contained in the Launches Explore.
As you can see, both of these Explores do share some fields, so in our example, we will merge using the App/Desktop Name value that exists in both.
How to Merge Reports
The first step is to choose one of the two Explores you intend to use and create the basic report as you would normally. Below we will start with the Launches Explore.
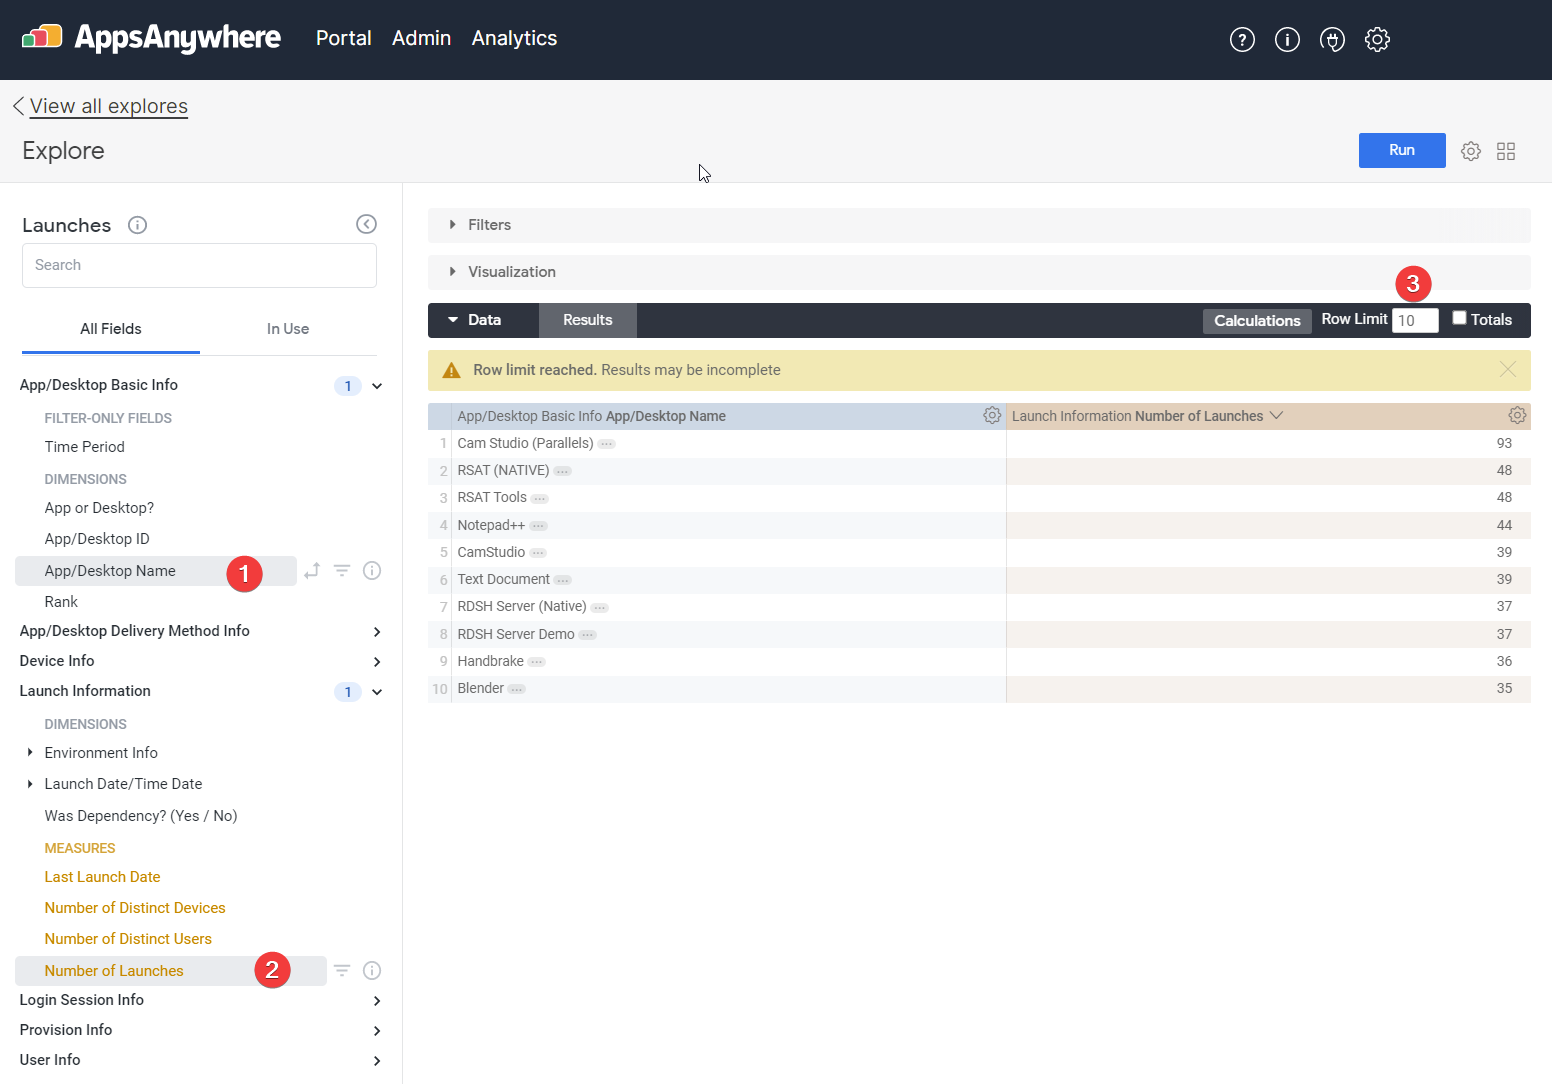
Here the App/Desktop Name has been selected
Then the Number of Launches was selected
(Optional)To make the report more manageable, it has been limited to the top 10 results
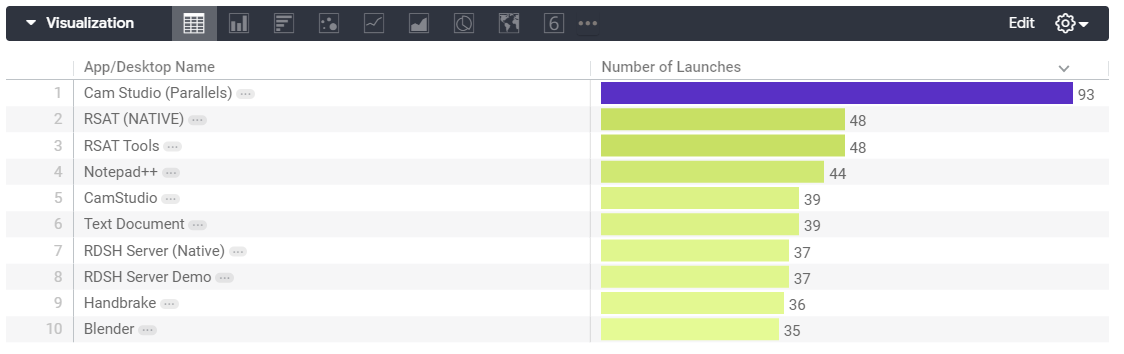
For the visualisation, we have chosen to display as a Table
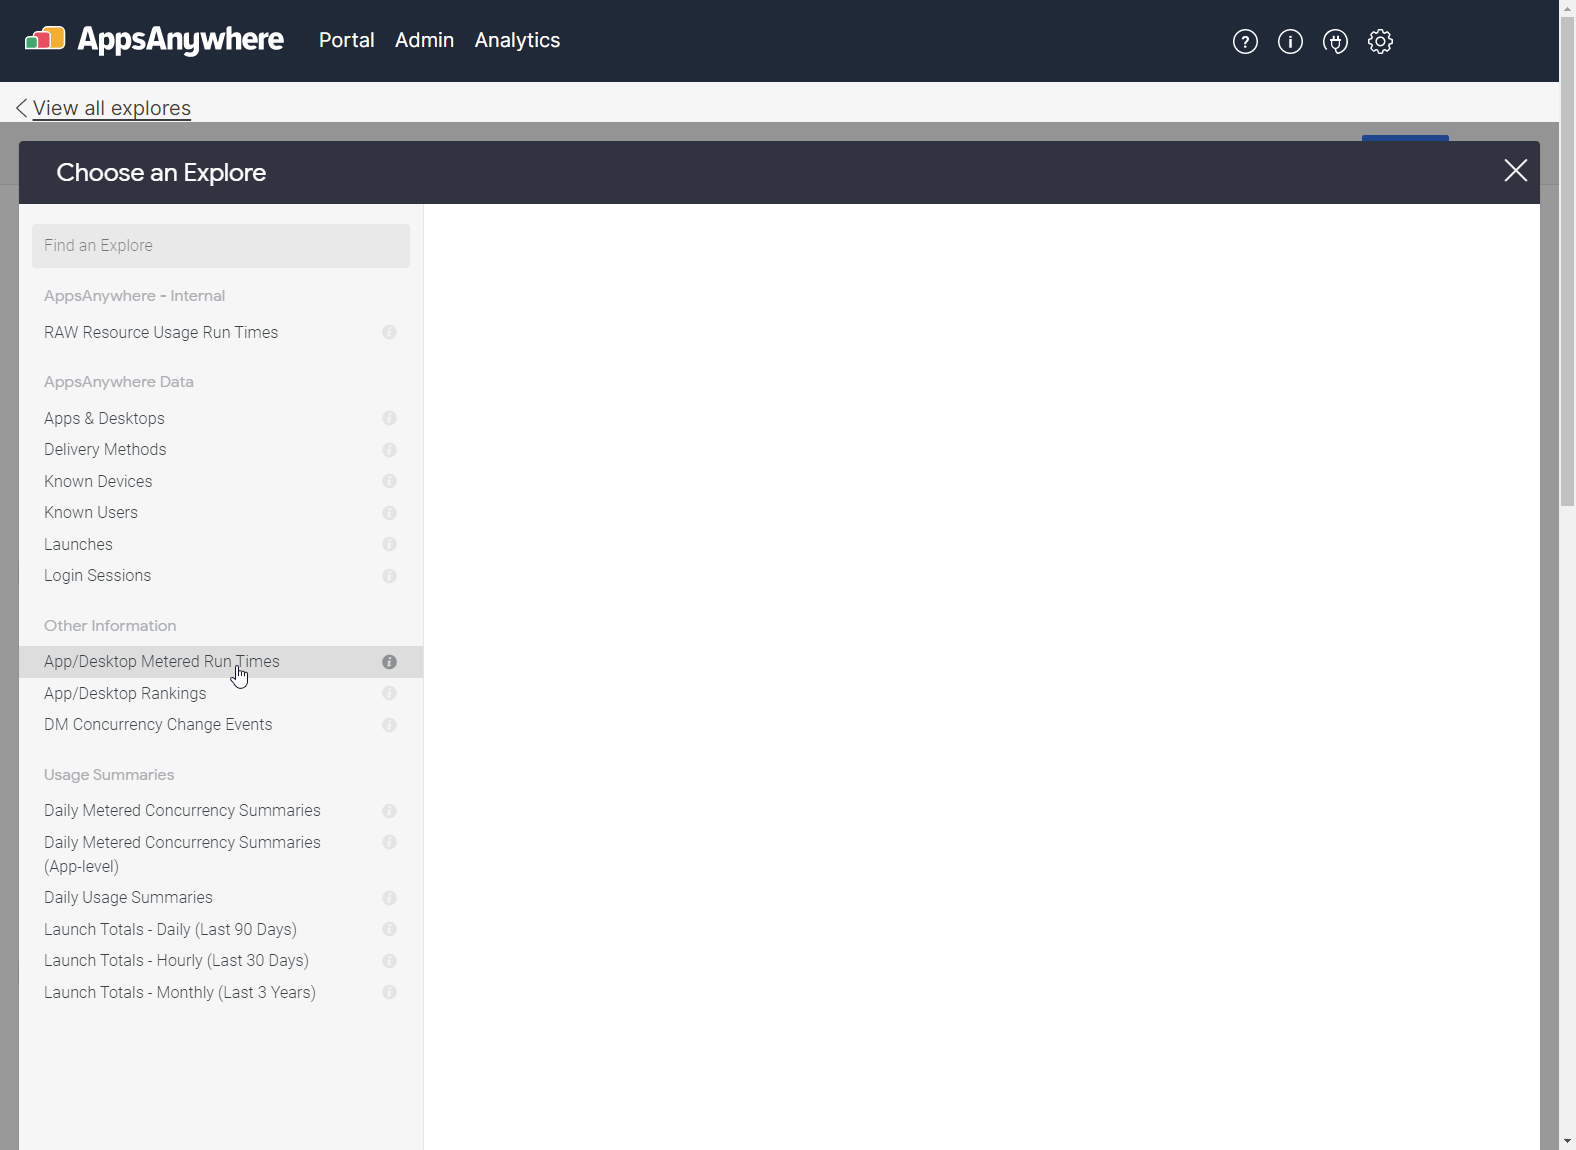
Now instead of saving this report as a Look or to a Dashboard, we can choose the Merge Reports function from the Settings icon to bring in a second Explore.

You are now prompted to choose the second Explore you wish to use. In our example, we will proceed with the App/Desktop Metered Run Times Explore
On the next screen, we choose the fields we want to report on.
Here the App/Desktop Name has been selected
Then the Total Run Time was selected
(Optional)To make the report more manageable, it has been limited to the top 10 results
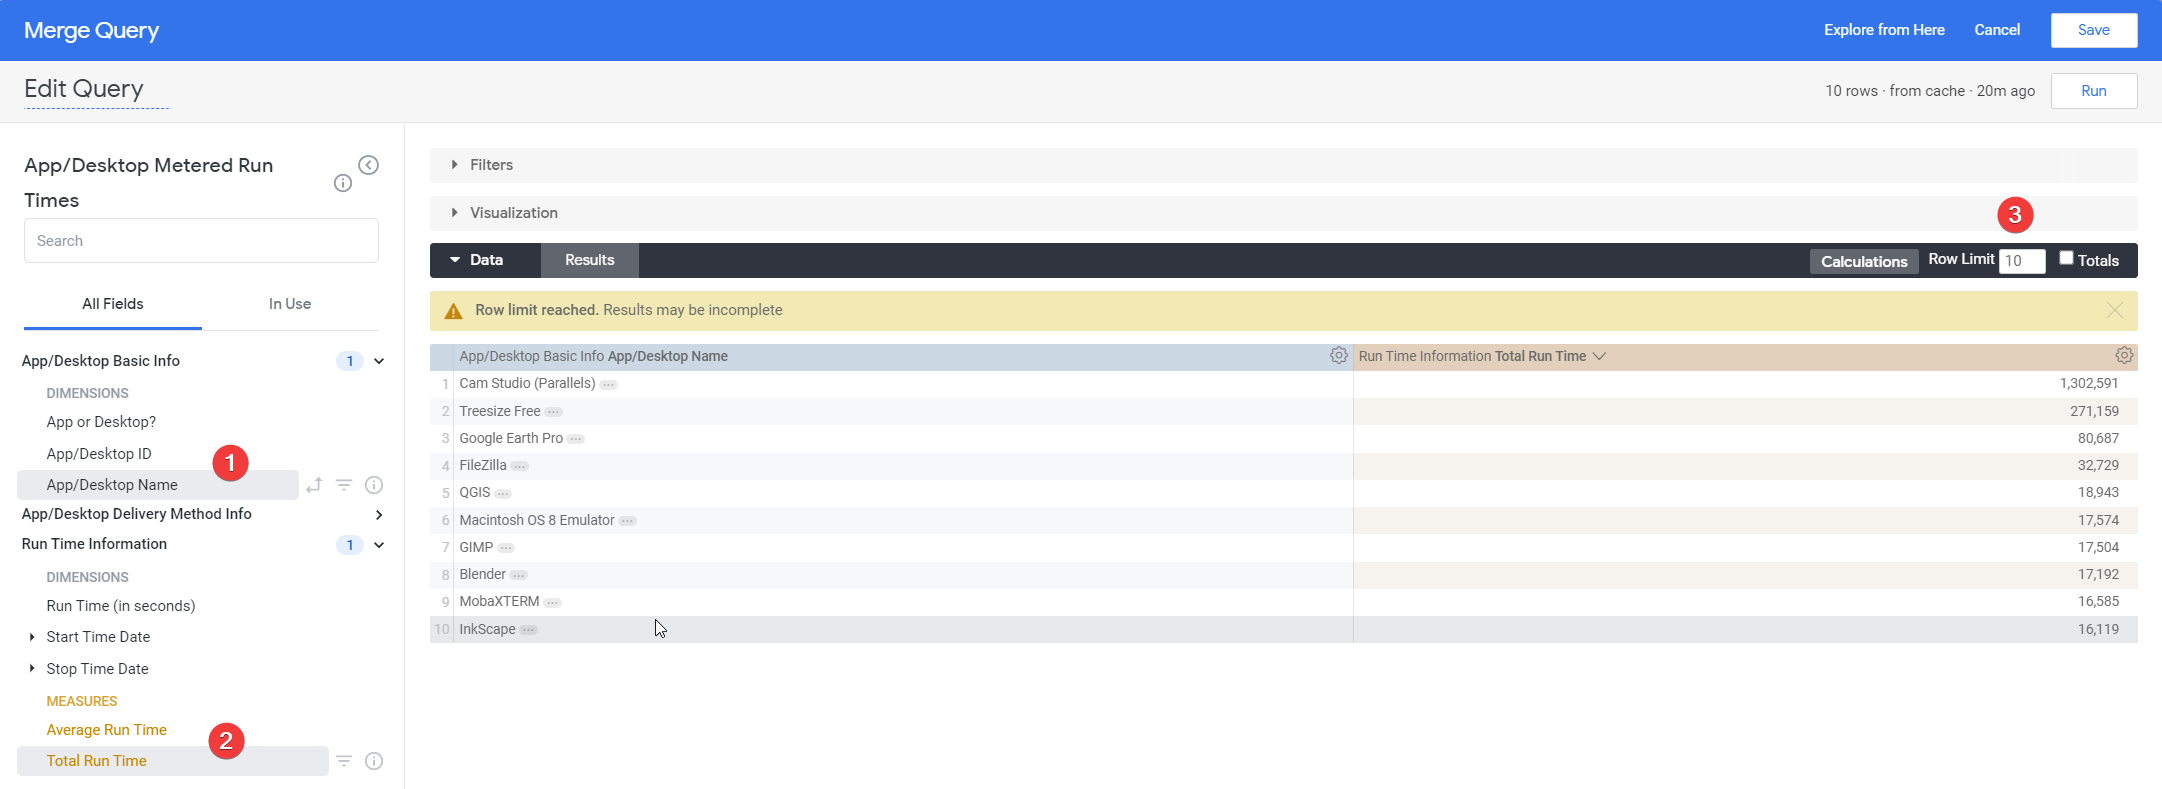
When you select time-based results, such as Total Run TIme they will be displayed as seconds. Whilst this is accurate, it is not ‘human readable’ so we can perform a Calculation to format this value as shown in the example below.

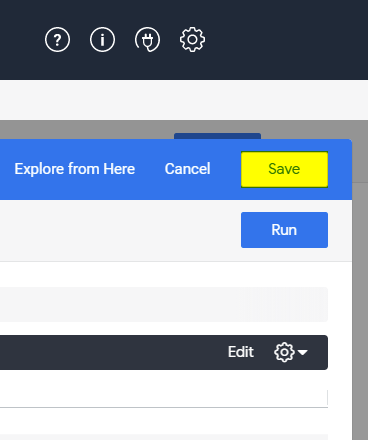
Now that the two reports have been created, select the Save button at the top right on the menu bar to merge the reports.
The next screen should now display the overview of the merged results.
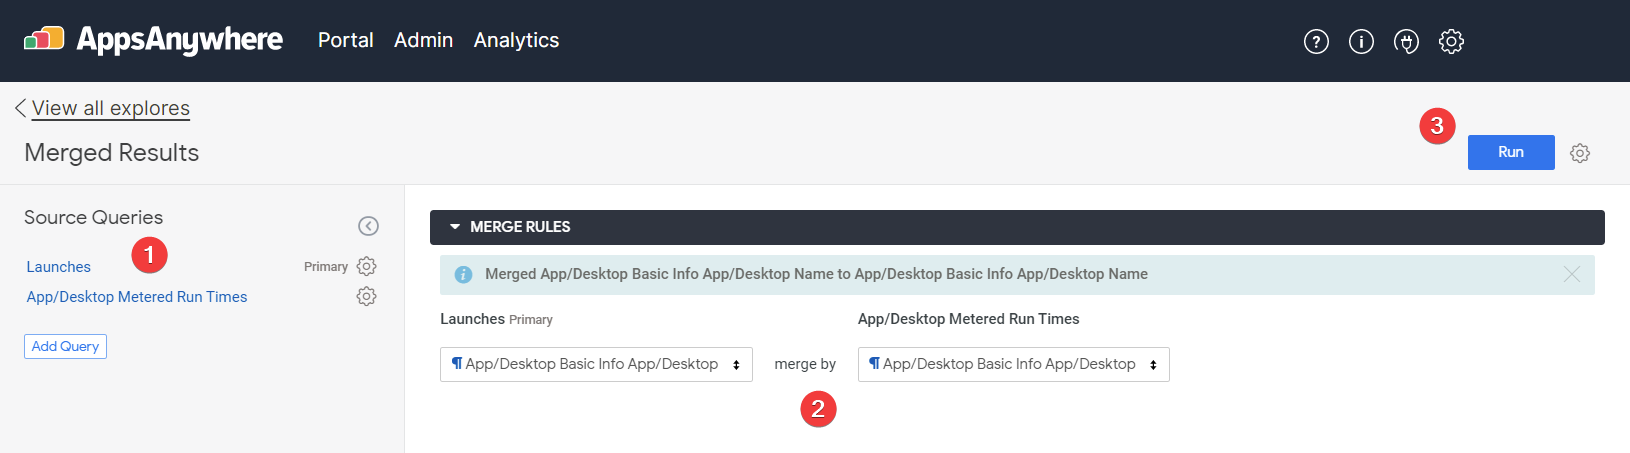
On the left, the two Explores are listed. If you click the link you can go back and edit these.
The Merge Rules displays the fields that you report with merge on. In our case this is the App/Desktop Name field that exists in both Explores.
Hit Run to see your merged report.
If you wish to add a third or fourth Explore, then simply click the Add Query button on the left of the screen to repeat the above process.
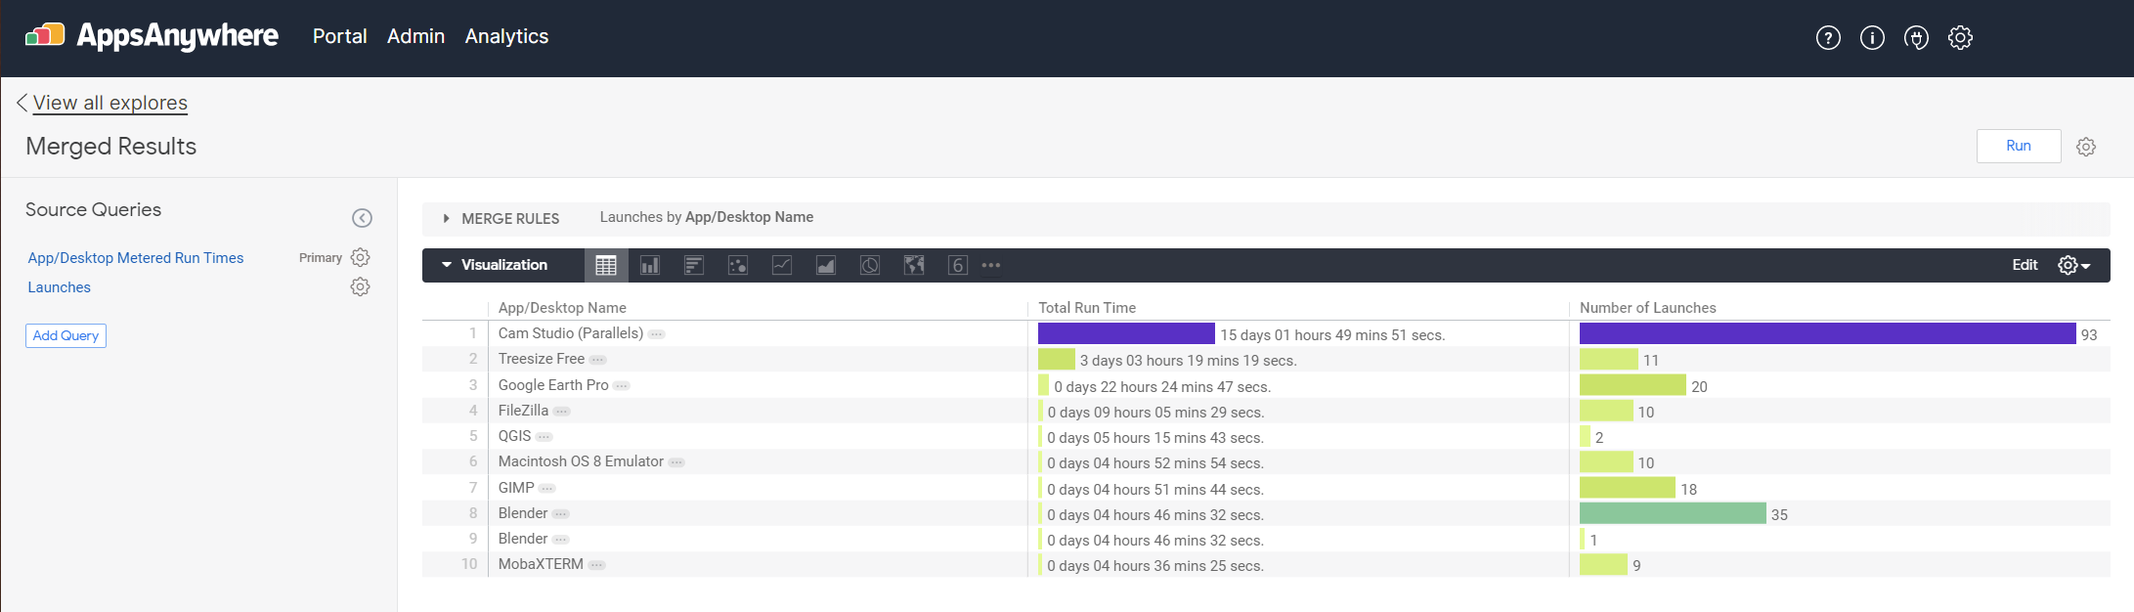
The report is now displaying the top 10 applications based on runtime and launches, pulling the data from the multiple Explores that you have selected.
Now simply save your report to a Dashboard in the normal manner.
Further information can be found directly on the Looker website