
This feature requires Cloud Delivery.
Overview
Cloud Delivery reporting tools are available to System Admin users when Analytics is enabled on the appliance. The reports are generated automatically and are updated daily. You can view session counts, concurrency limits, session durations, total usage hours, and unique users. These metrics support smarter resource planning, license management, and strategic decision-making across IT operations—ensuring efficient and data-driven app delivery. These reports can be seen for every Cloud Delivery environment and between a start and end date.
Viewing Cloud Delivery Reports
-
Make sure that Analytics is Enabled on your appliance
-
Log into AppsAnywhere as a System Admin user
-
Click on Admin in the user menu to access the AppsAnywhere admin portal
-
On the navigation menu on the left of the page, go to Cloud Delivery → Reports
This will show a page with Concurrency and Usage figures for a certain environment in a date range. You can change the Environment you want to look at with the drop down menu at the top of the page, as well as change the start date and end date using calendar date pickers.
Dates cannot be in the future or more than 12 months in the past
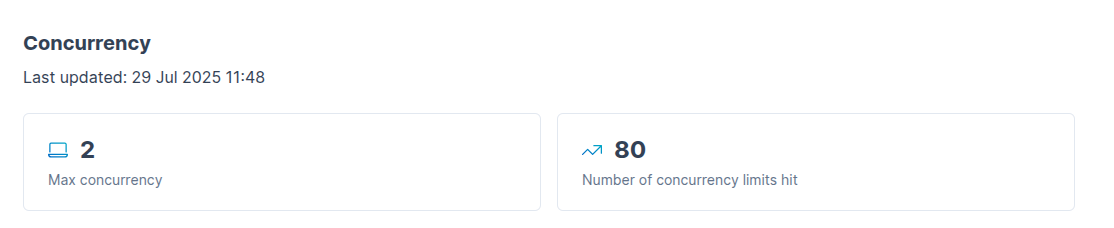
Concurrency
Concurrency data is gathered automatically when the page is opened or refreshed. The last date that data was gathered is also shown.
Concurrency reports contain 2 figure that are outlined below.
|
Metric |
Description |
|---|---|
|
Max concurrency |
For the chosen environment, between the dates selected, the max number of sessions that were running at the same time |
|
Number of concurrency limits hit |
For the chosen environment, between the dates selected, the number of times a user tried to start a session but was rejected due to concurrency limit already being reached |
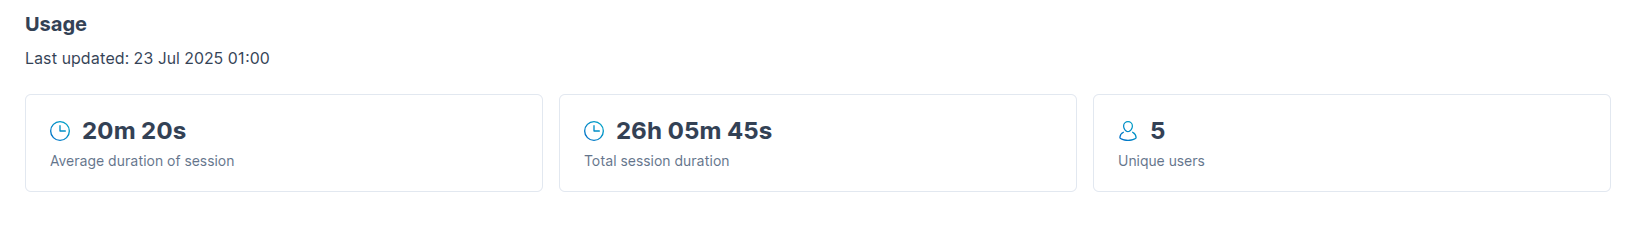
Usage
The usage reports automatically gather data every night, which can then accessed when the reports screen is next visited. The reporting shows the last date that the data shown was updated. As the gathering of data happens every night, there could be up to 24 hours since the data was last updated.
If you think that the data should have been retrieved after this date please contact support
Usage reports contain 3 figures that are outlined below.
|
Metric |
Description |
|---|---|
|
Average duration of session |
For the chosen environment, between the dates selected, the average length of a session |
|
Total session duration |
For the chosen environment, between the dates selected, the total time that users have been in a session. |
|
Unique users |
For the chosen environment, between the dates selected, the number of unique users that have opened a session. |