Overview
Analytics allows you to run custom calculations and formatting against particular fields. This has many uses, but can be particularly useful in presenting raw data in a human-readable format.
Example
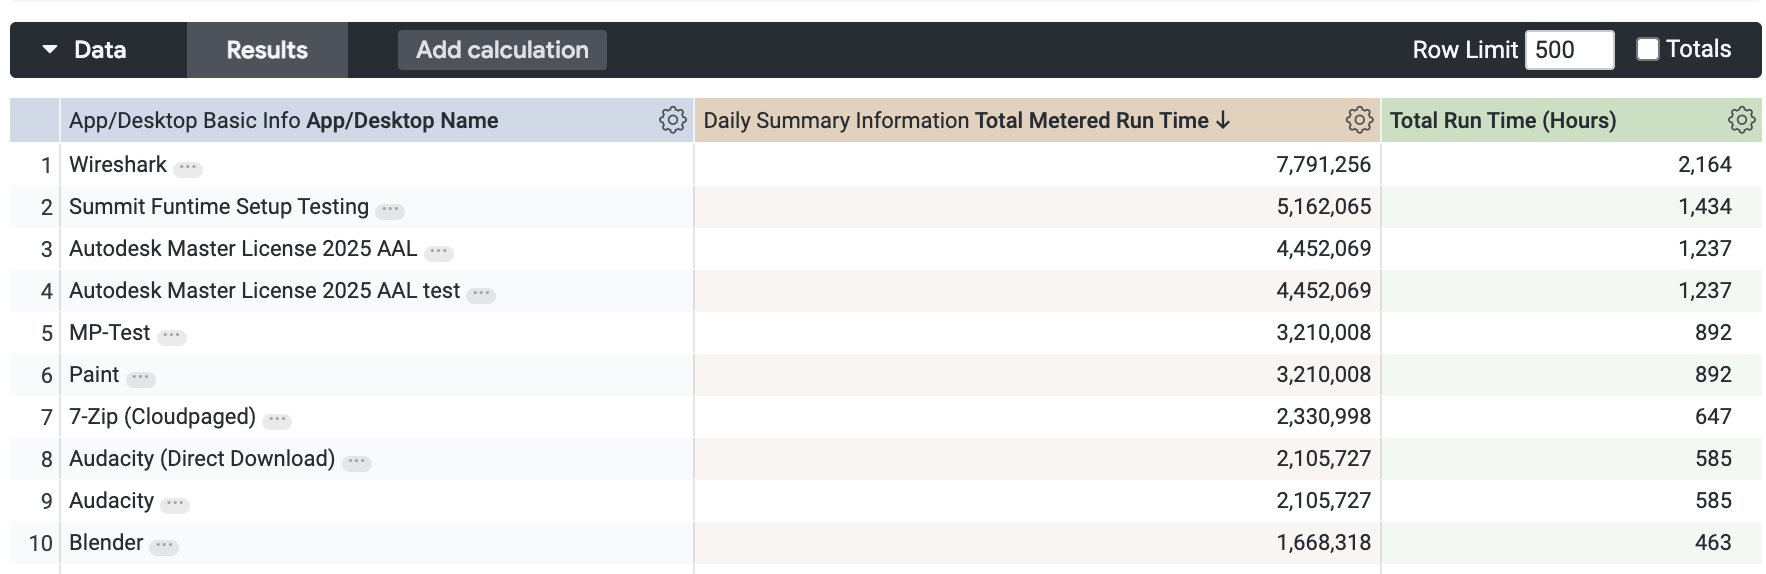
Using the Daily Usage Summaries Explore, create a simple report to show the Total Metered Run Time for each application (App/Desktop Name)
Hit Run and view the Visualization as a Table
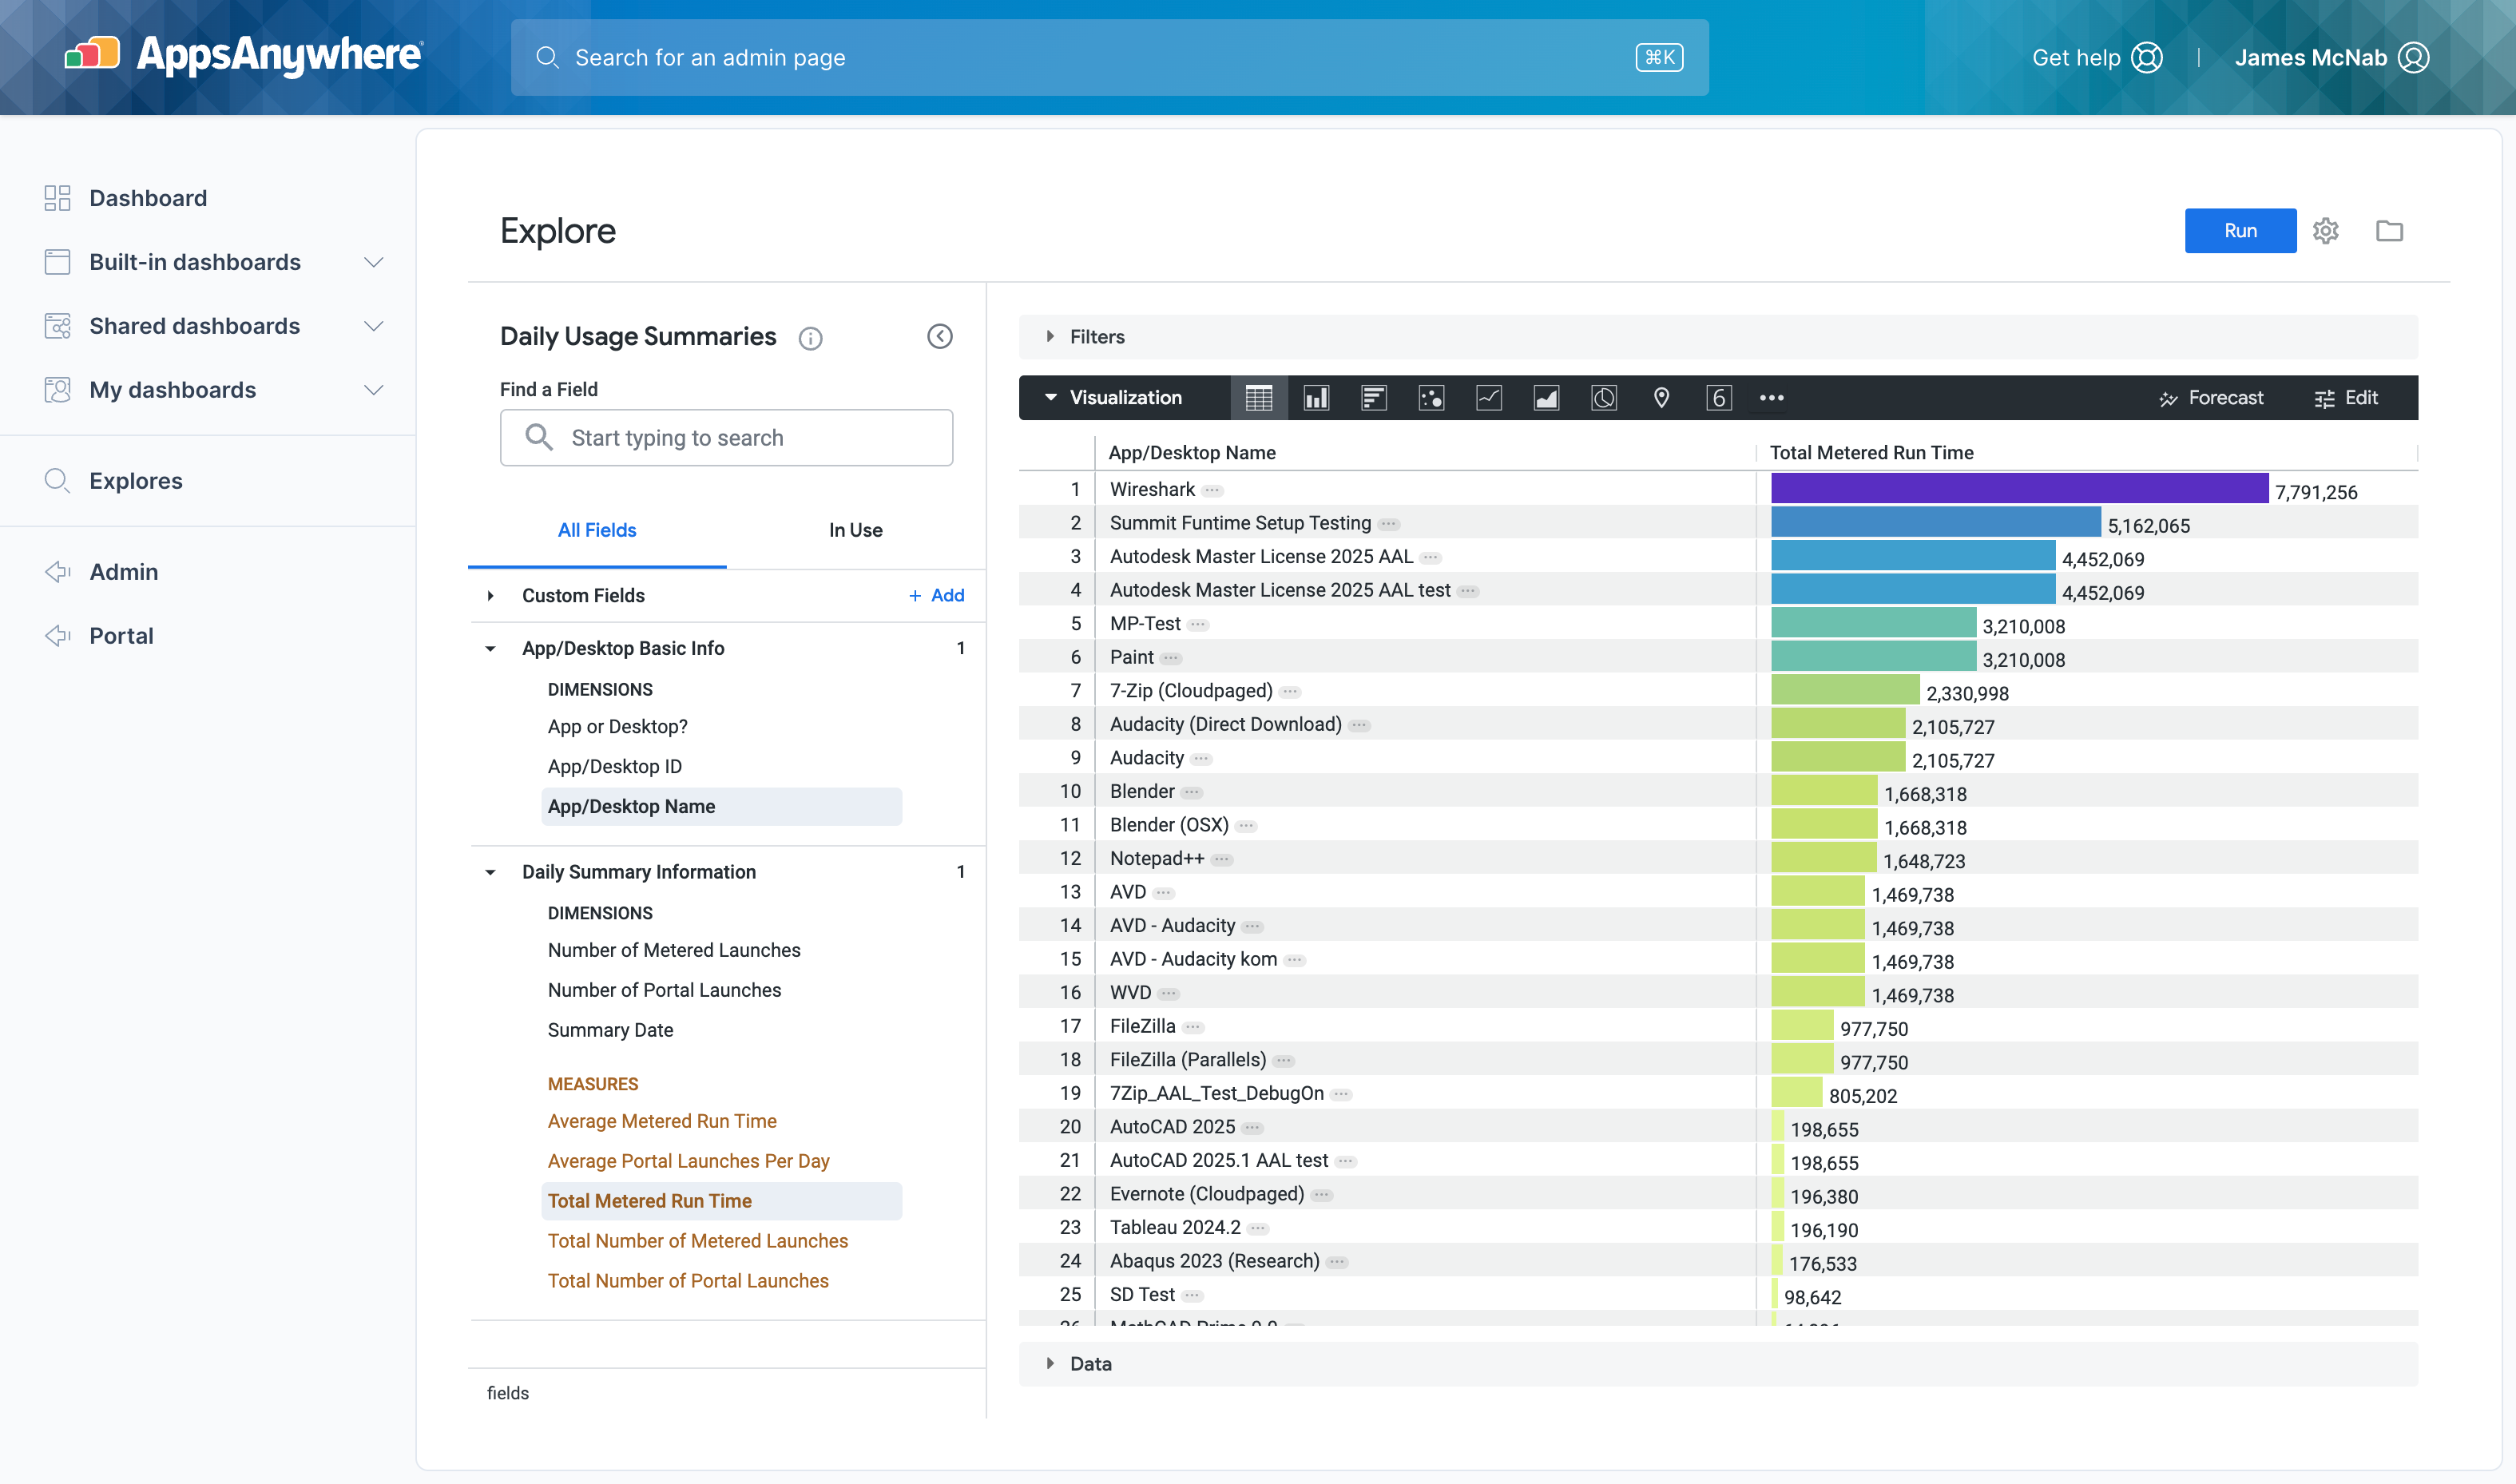
This displays the list of applications and the total run time for each one, expressed as seconds.
As the example above shows, the top application by usage is Wireshark with is showing as having run for 7,791,256 seconds.
Whilst this is correct and accurate, this is is not the most understandable way to present this information, so it would be useful to be able to format or calculate a more ‘human readable' value to display.
Creating a calculation
Example: Metered application runtime in hours
In this example we will convert the total recorded run time for applications from seconds to hours.
-
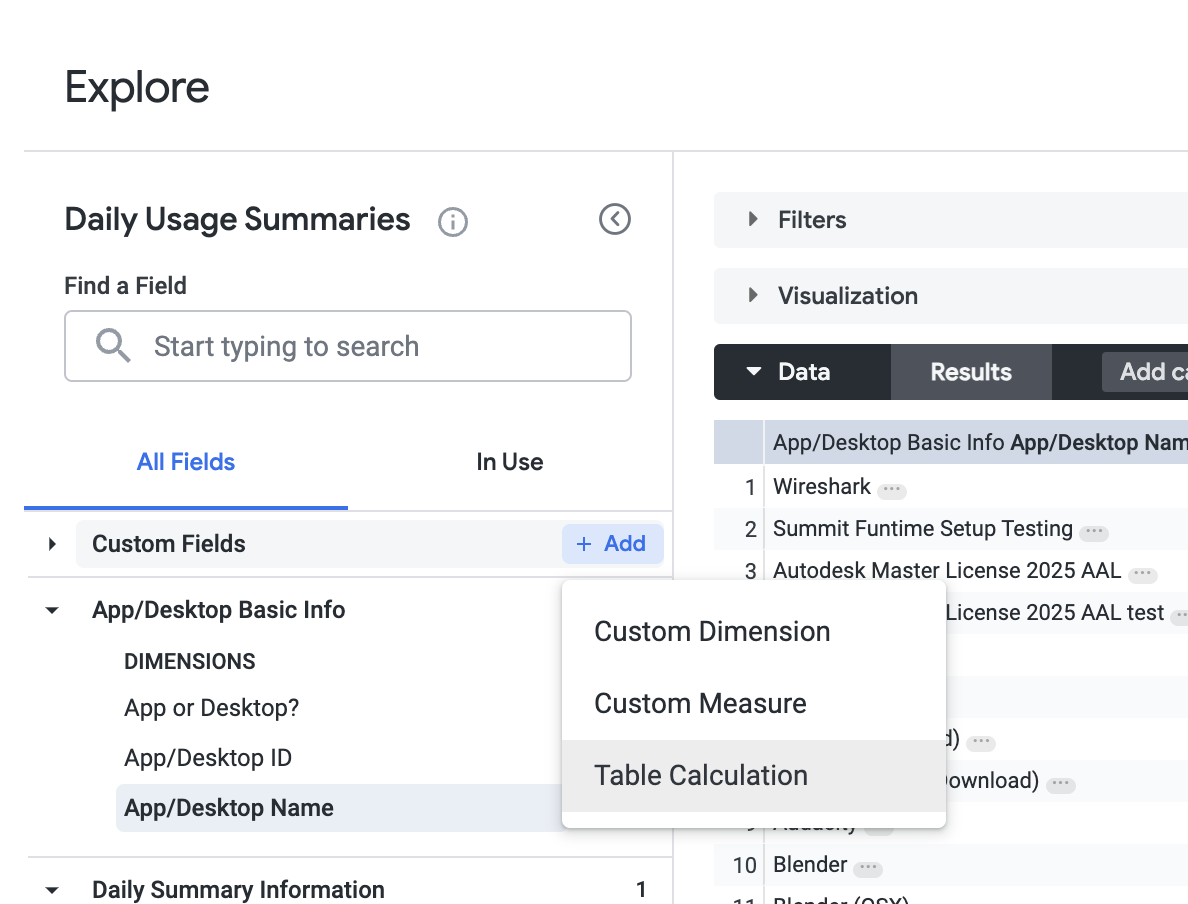
From the field selector find Custom Fields and select + Add
-
From the dropdown menu, select Table Calculation
-
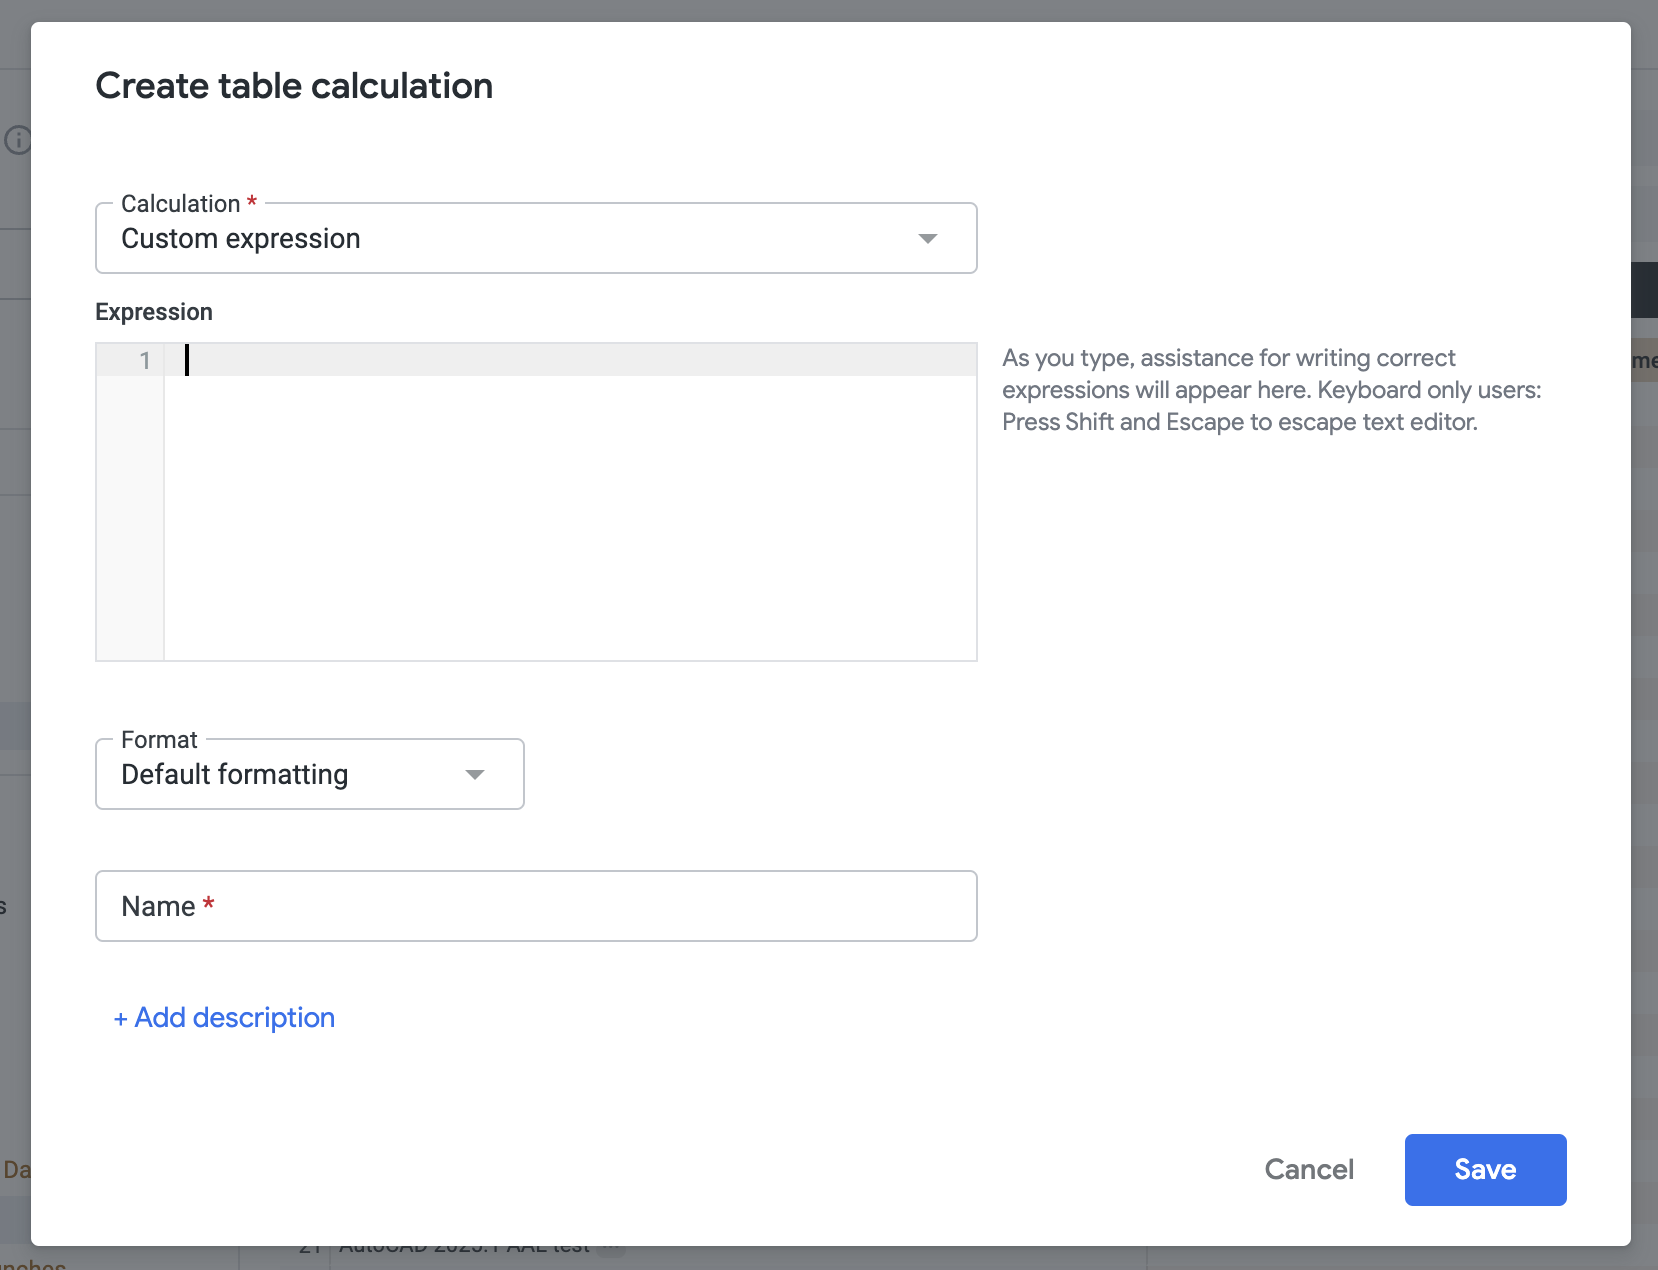
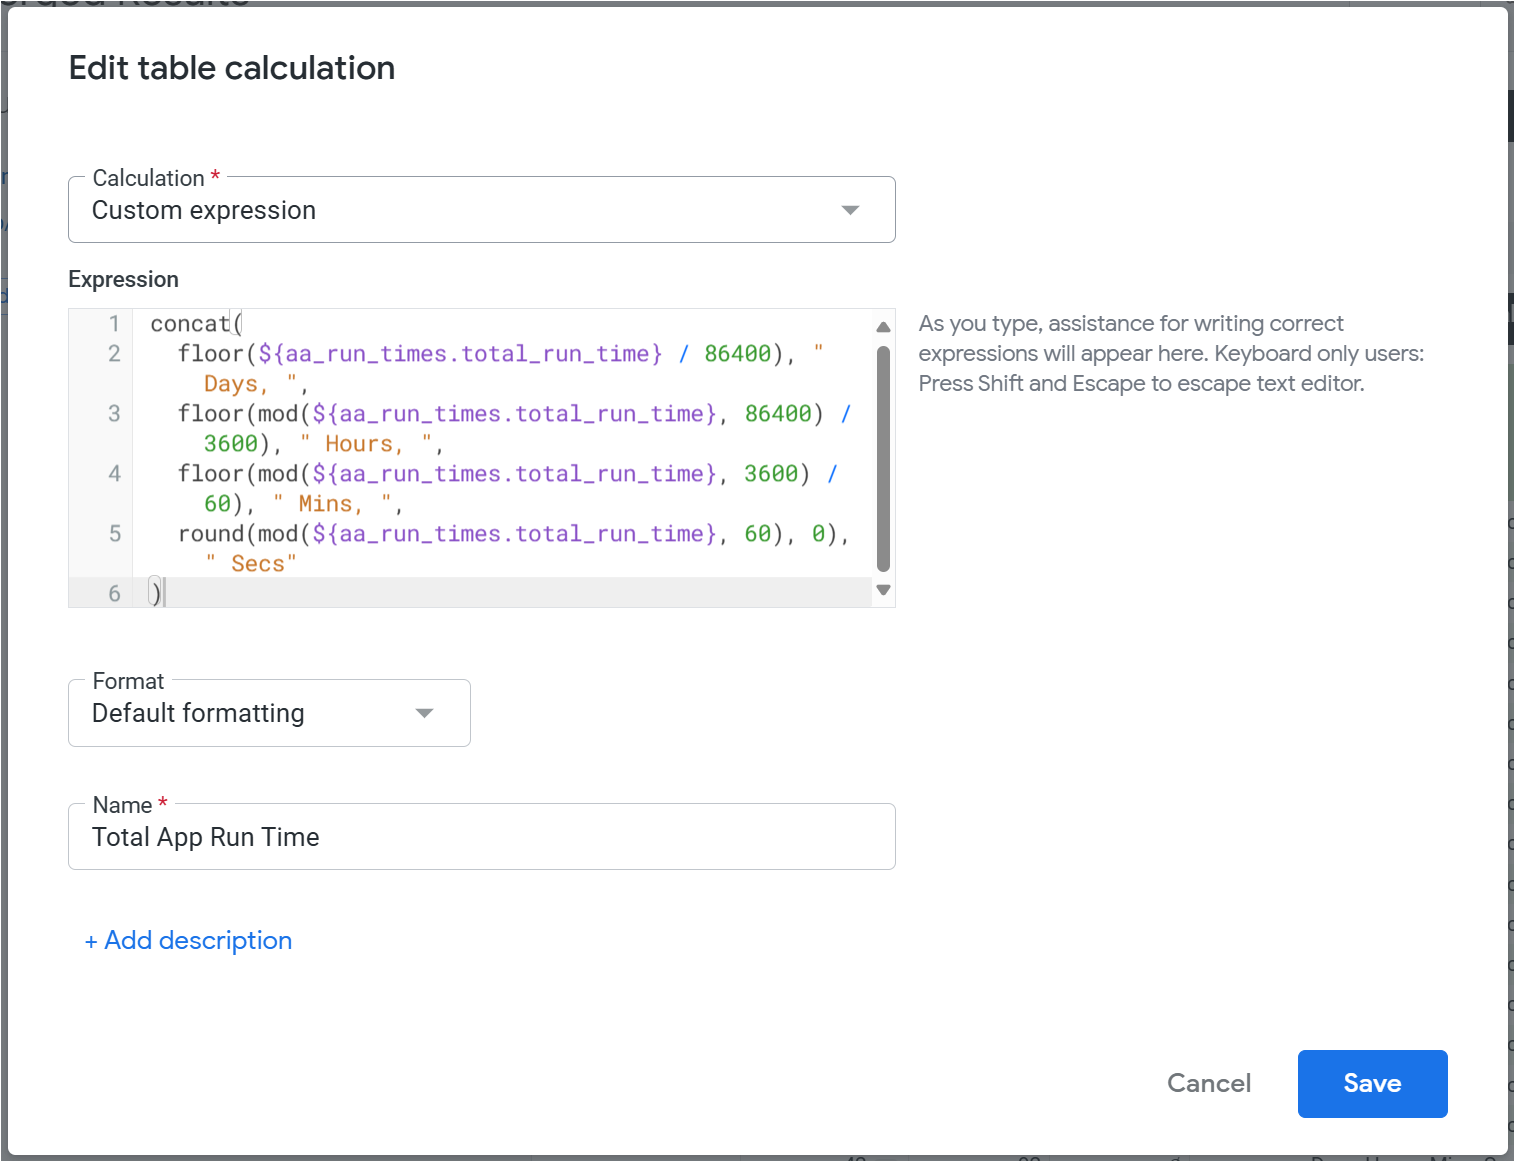
The Create table calculation dialogue will be displayed
-
From the Calculation dropdown, select Custom expression (this is the default)
-
Now we can add our calculation. This will display the results as days, hours, mins and seconds.
concat(
  floor(${aa_run_times.total_run_time} / 86400), " Days, ",
  floor(mod(${aa_run_times.total_run_time}, 86400) / 3600), " Hours, ",
  floor(mod(${aa_run_times.total_run_time}, 3600) / 60), " Mins, ",
  round(mod(${aa_run_times.total_run_time}, 60), 0), " Secs"
)
The concat command will join our query together.
floor will round the result down, so for example, if the result is 24.4 days, this will display as 24 days, and the mod command will get any leftover value (the 0.4) and base the following calculation on this.
The string ${aa_run_times.total_run_time} is the total value in seconds recorded in the database and the basis of our calculation
-
For Format, leave as Default formatting
-
Give the calculation a Name, which will appear in the data once the calculation is created. In this example we will use “Total App Run Time”.
-
Press the Save button to create the new table calculation
-
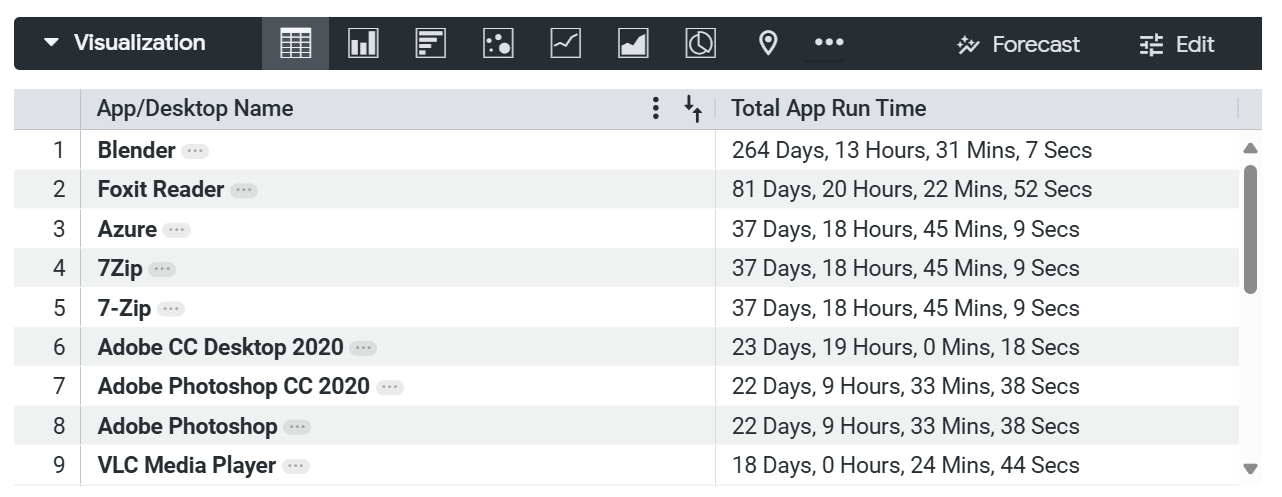
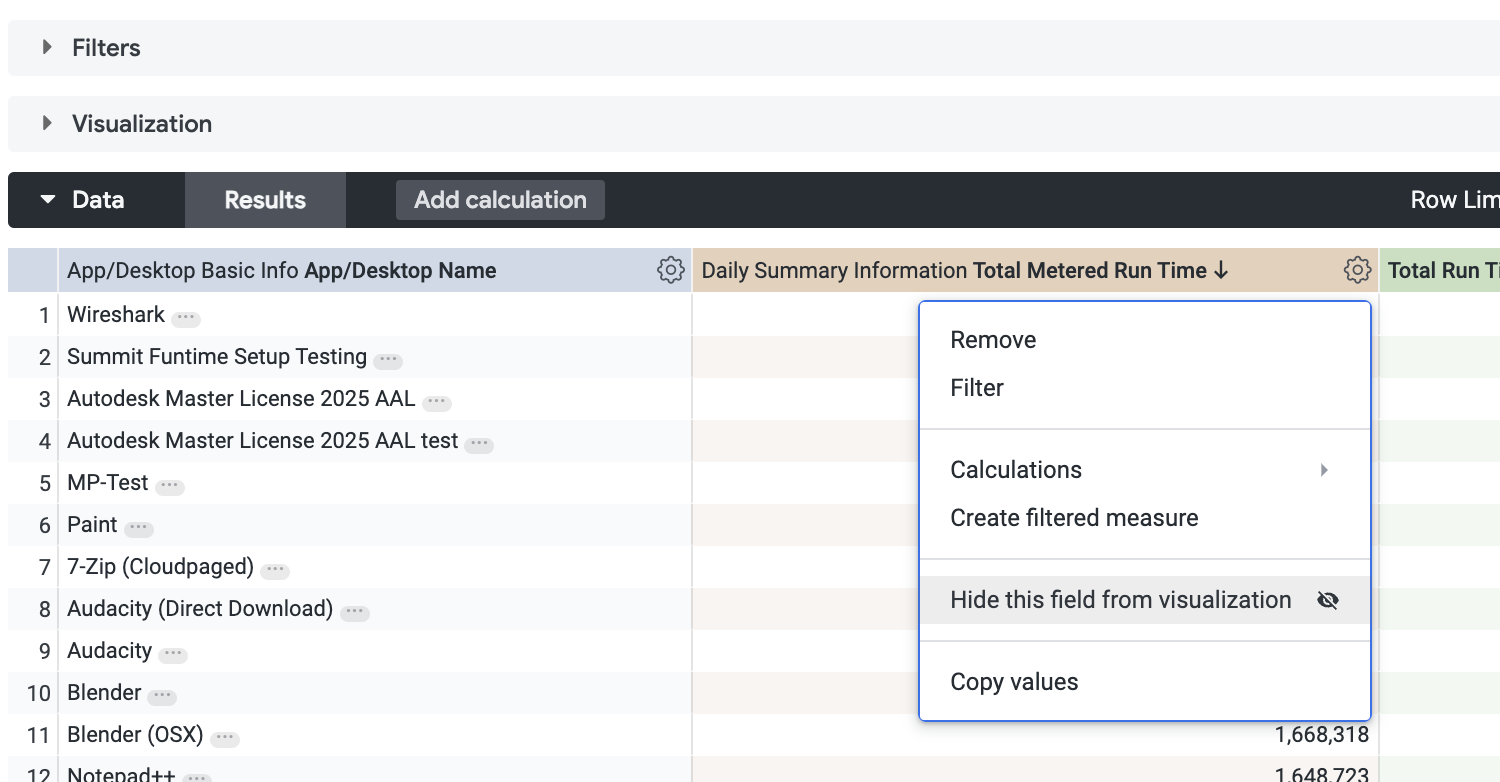
The new calculated value is now displayed in the Data and Visualization views of your report.
-
To stop the original value (seconds) from being displayed in your visualization, it can be hidden via the Data tab
-
Your report now shows the Total Run Time in a more human-readable format and can now be saved/added to your Dashboards as required.